Elevate your most important presentations with sharp visuals that command attention.
Each template transforms complex data into compelling frameworks visualized through high-impact infographics. Accelerate understanding, secure buy-in, and propel your initiatives forward. Master data and strategy with ease.
Ready to use. Customizable. No design skills required.
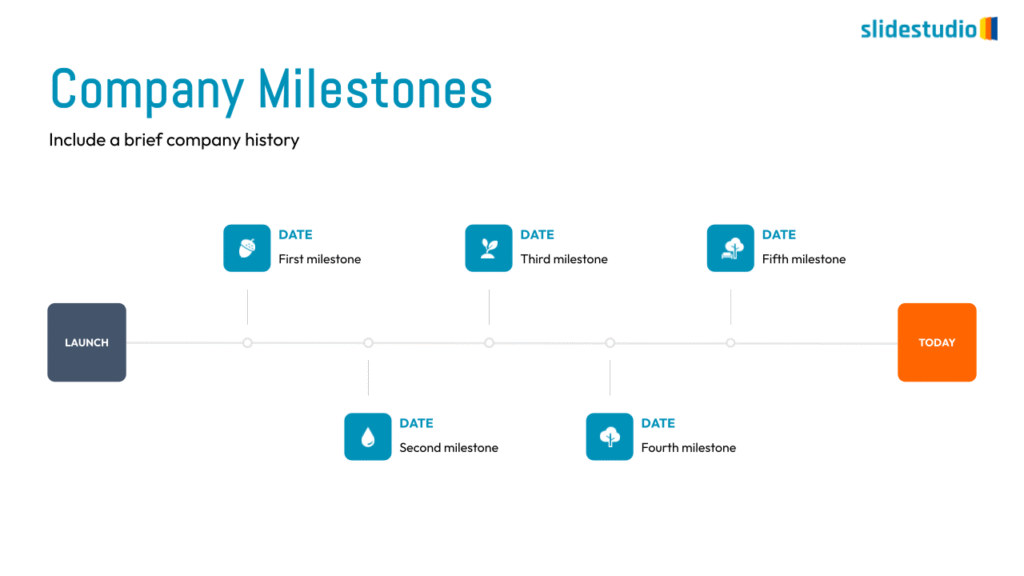
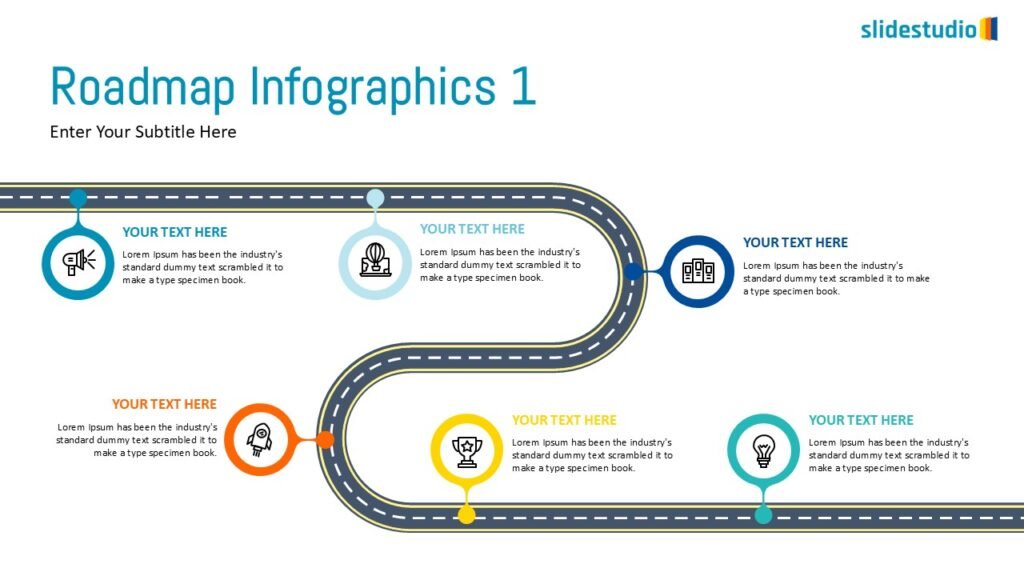
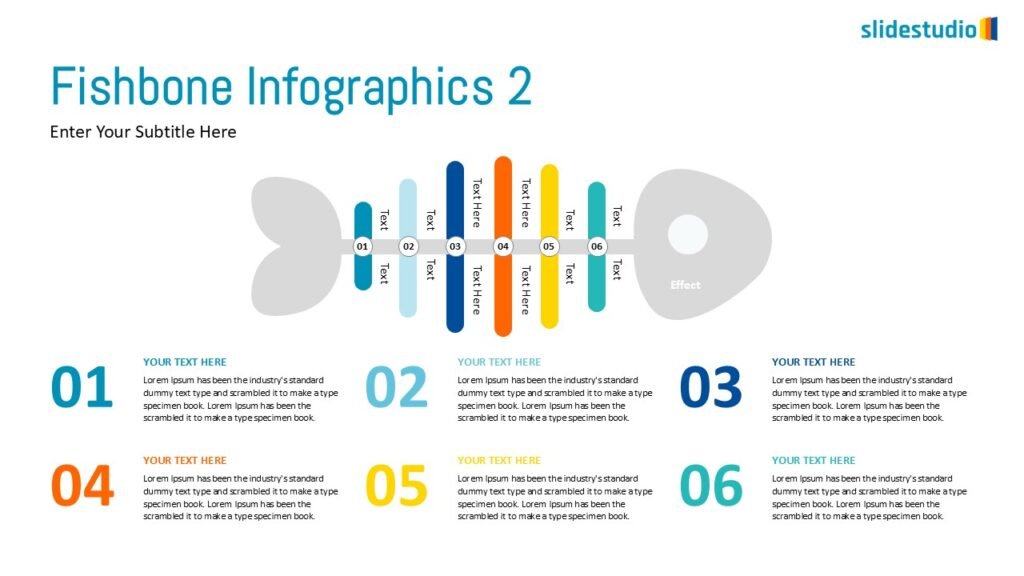
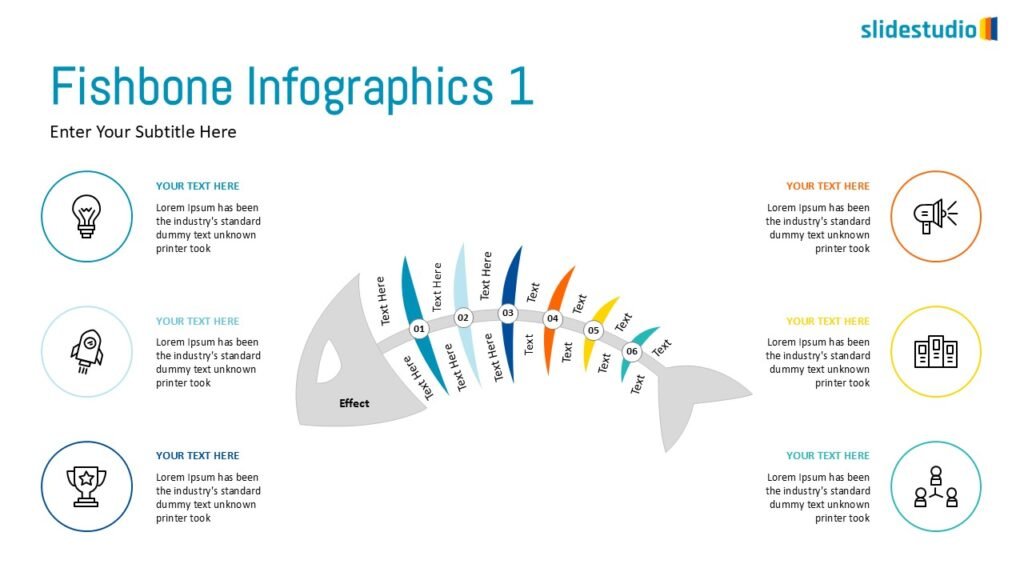
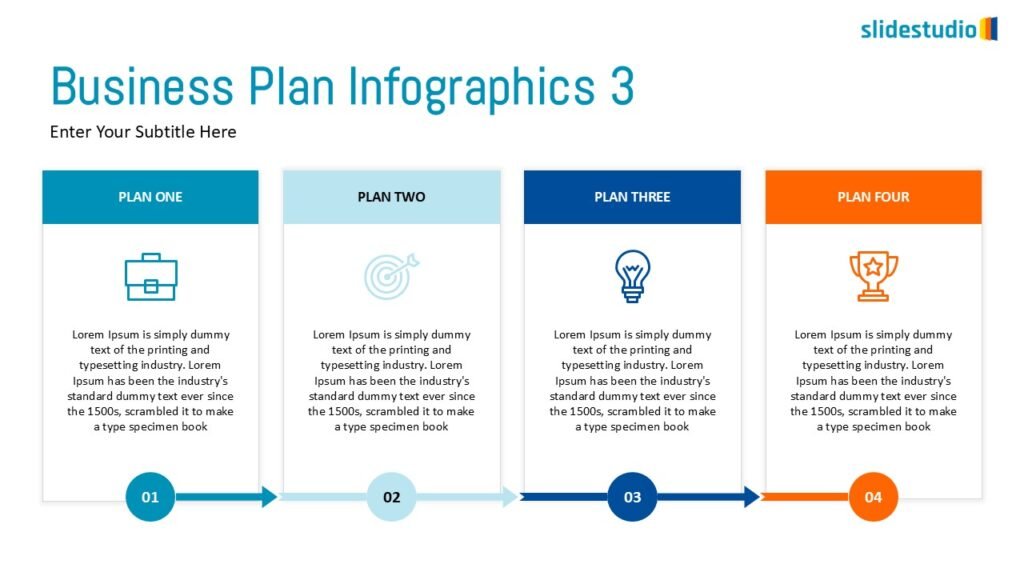
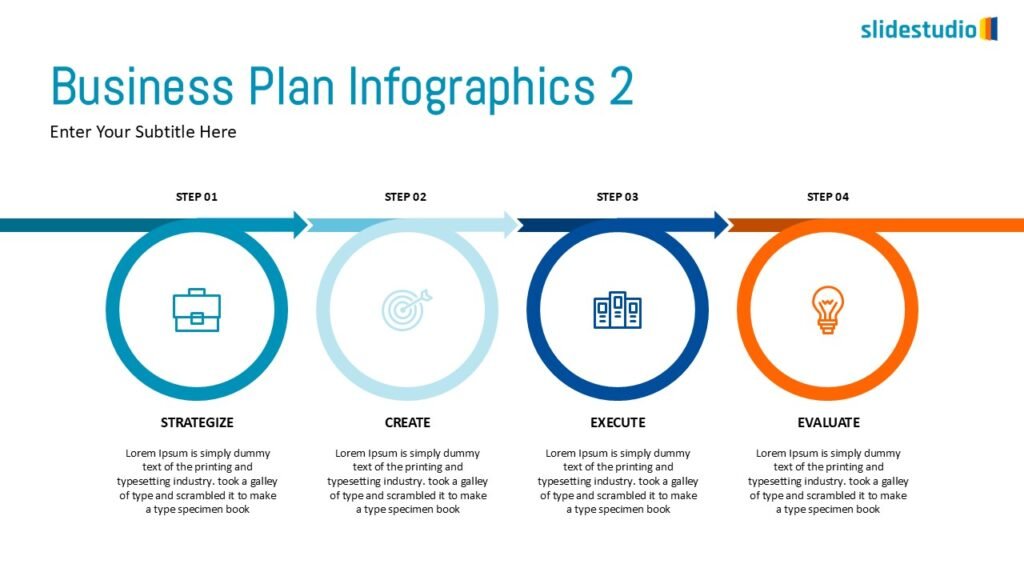
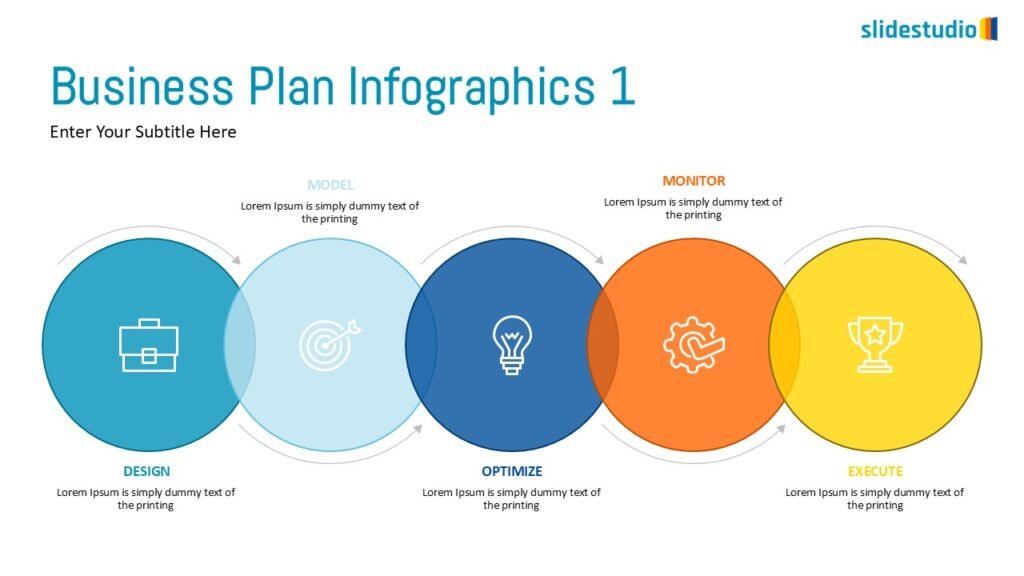
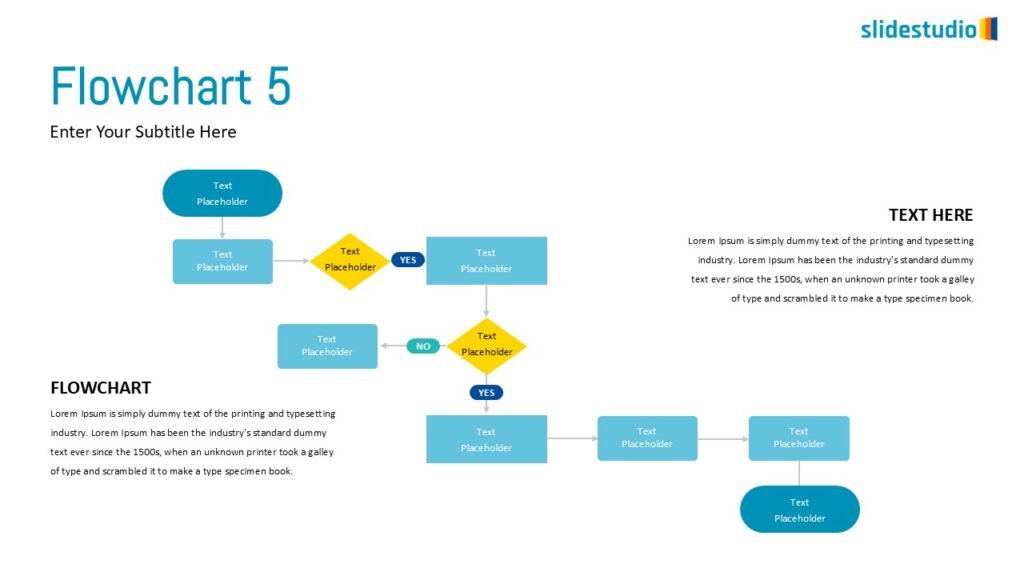
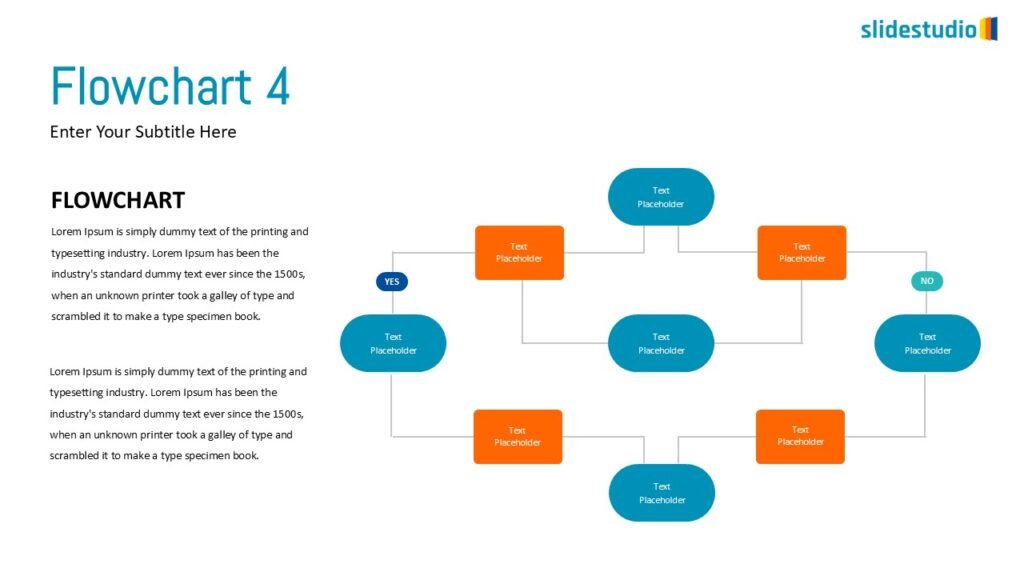
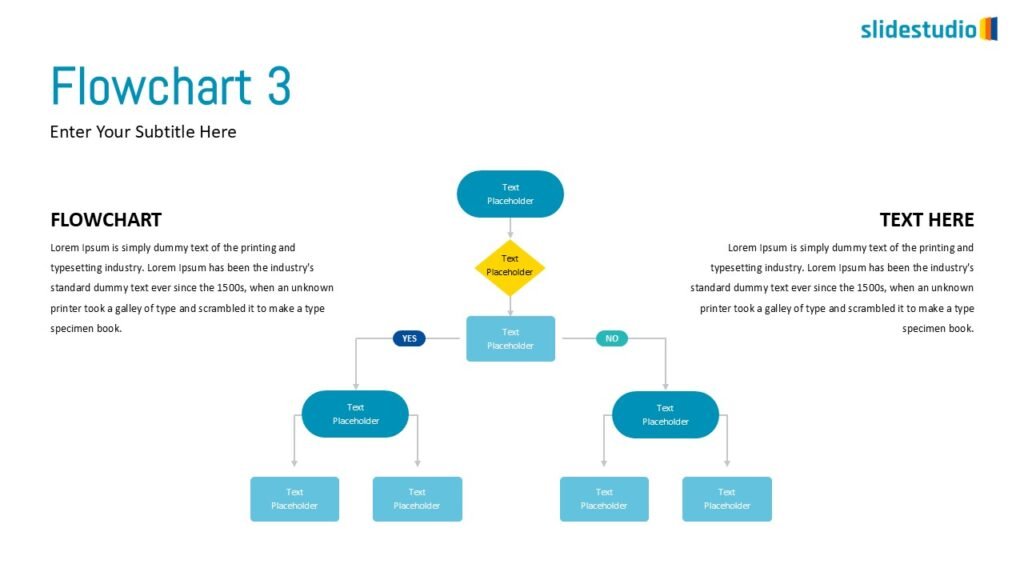
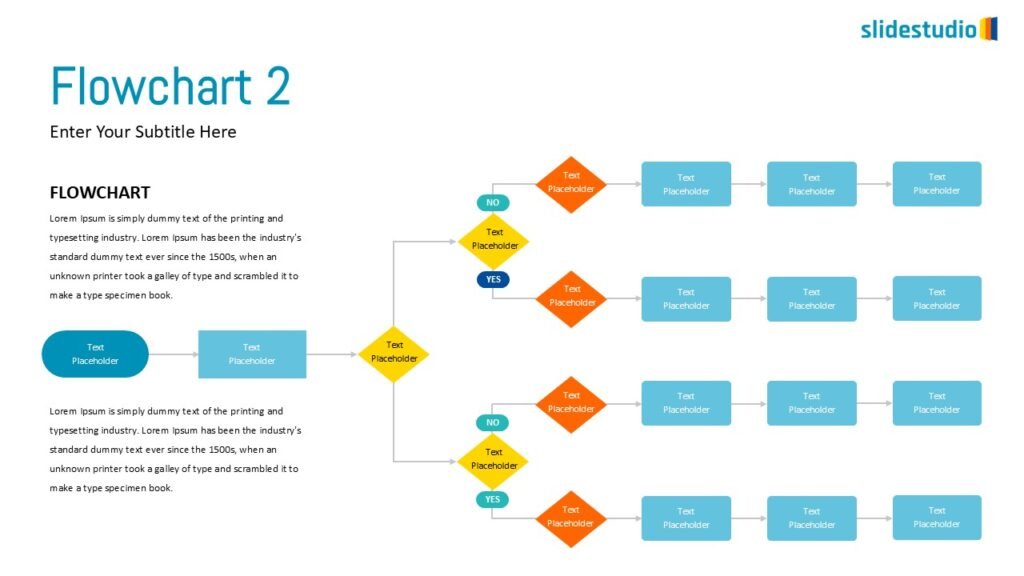
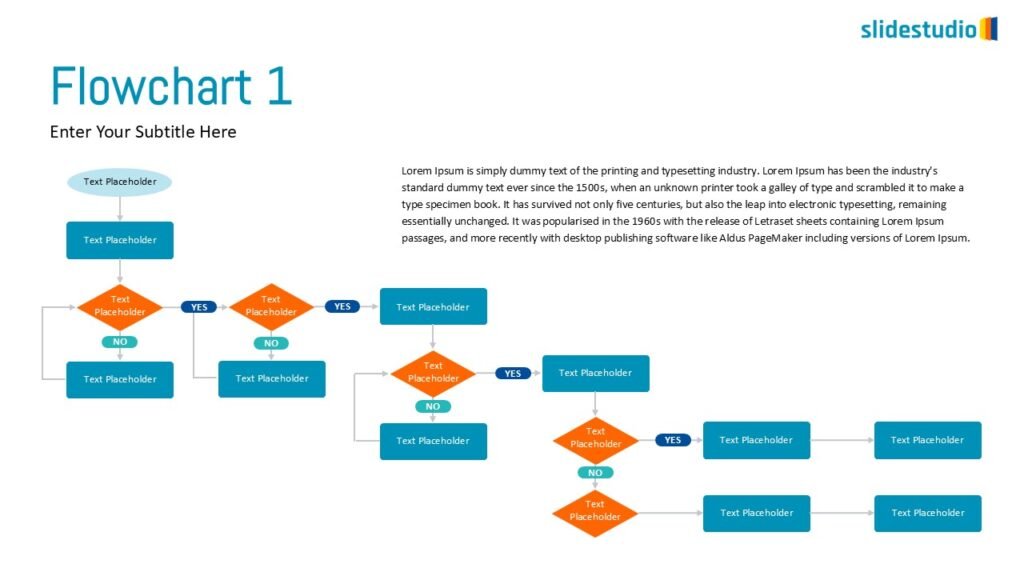
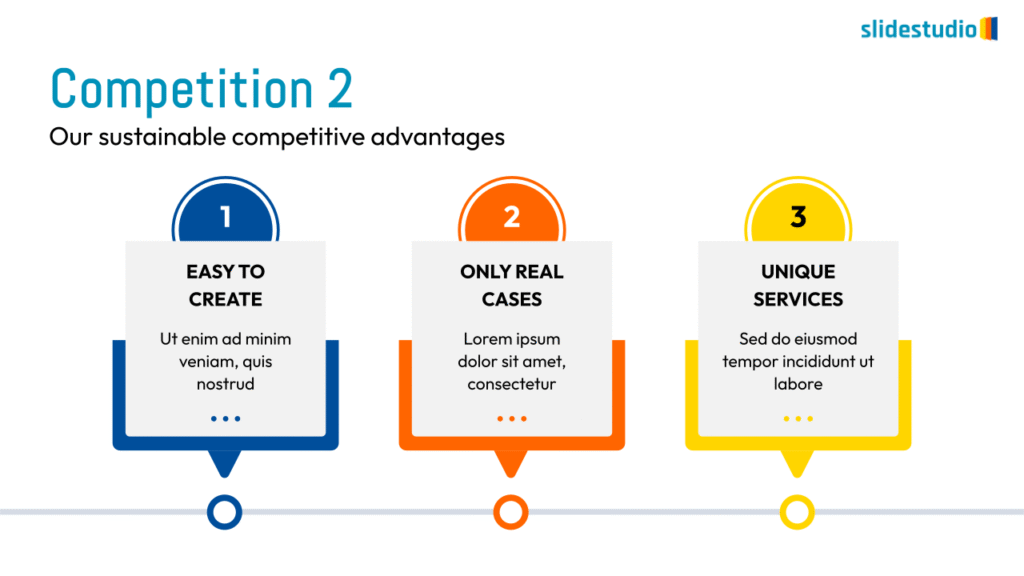
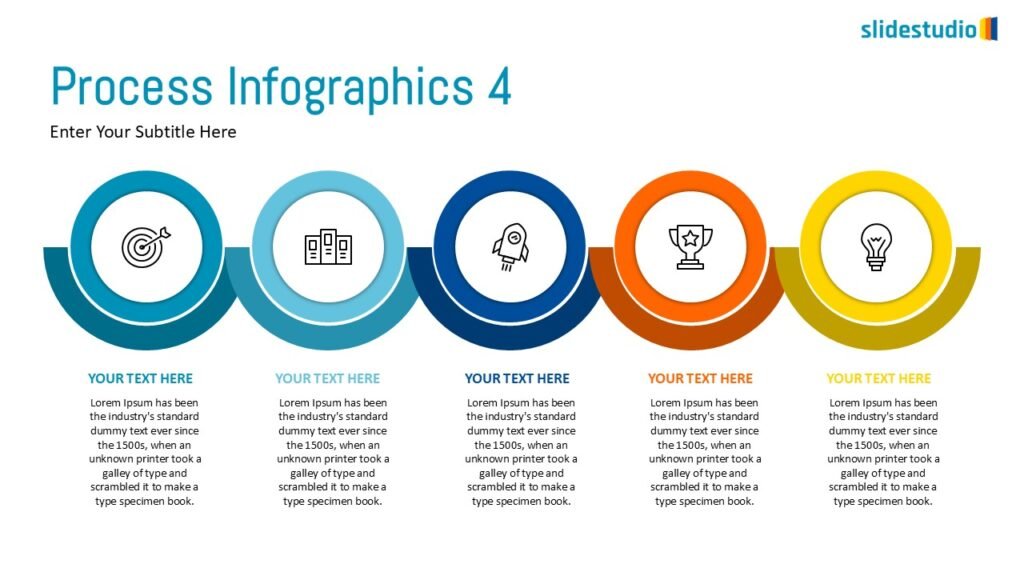
This concept focuses on illustrating the movement or progression of information. It can be represented in various forms, such as linear, circular, divergent/convergent, or multidirectional pathways, to convey how elements progress or connect in a sequence.
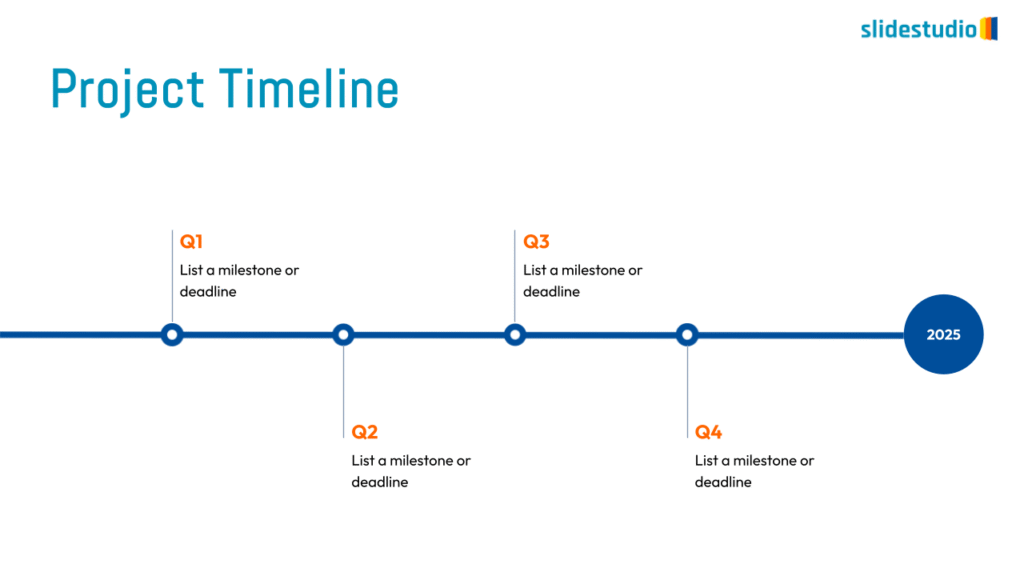
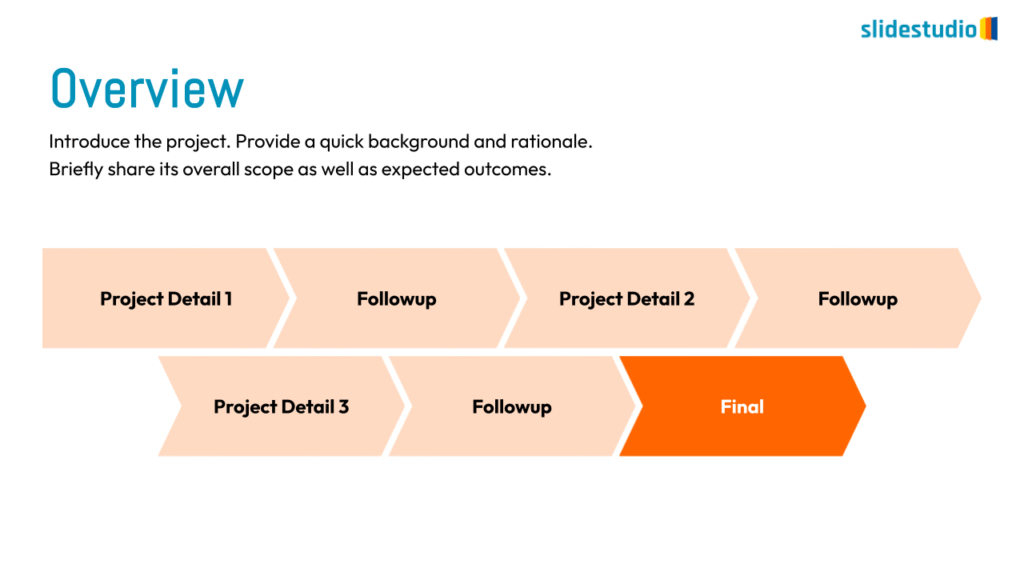
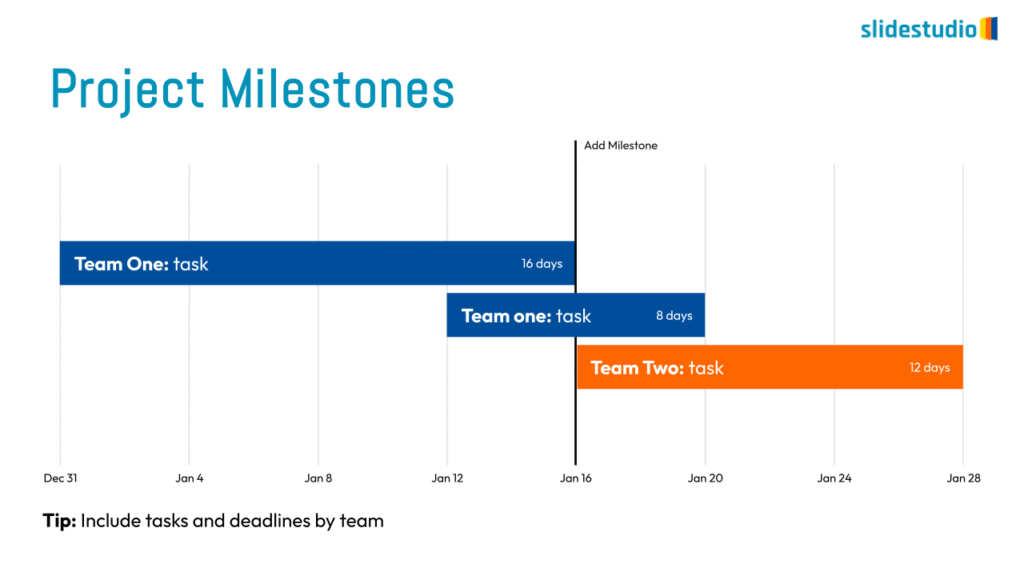
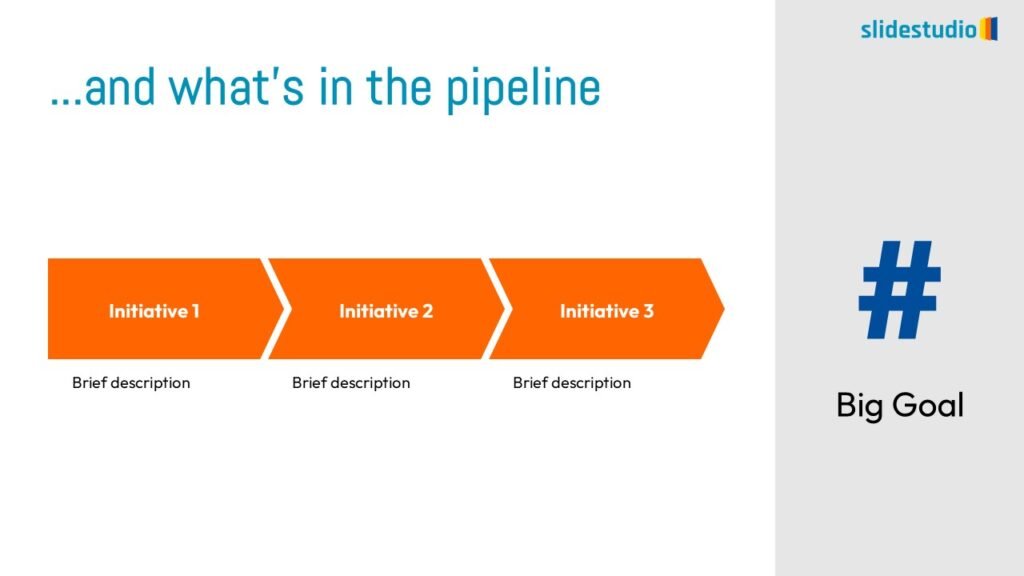
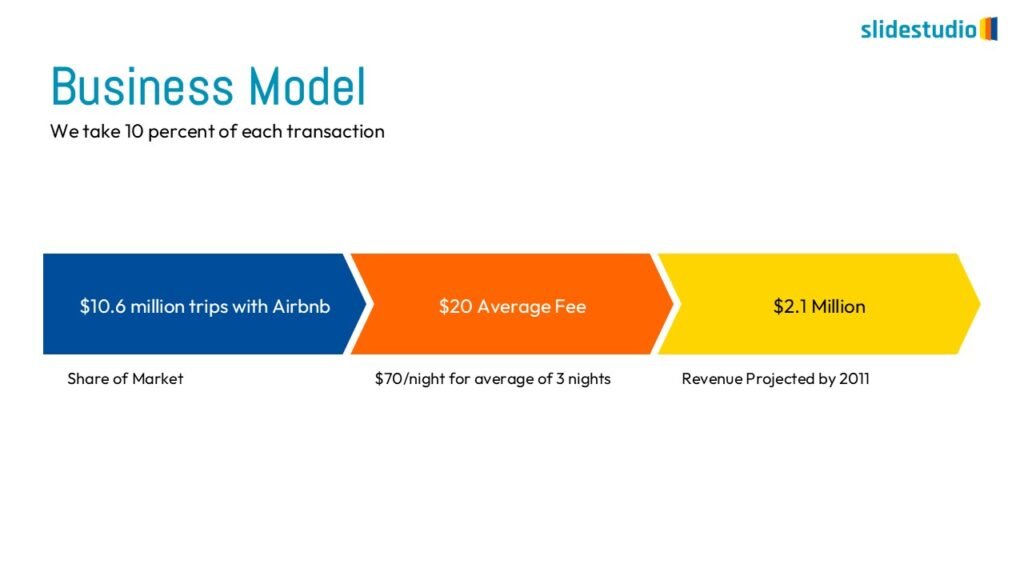
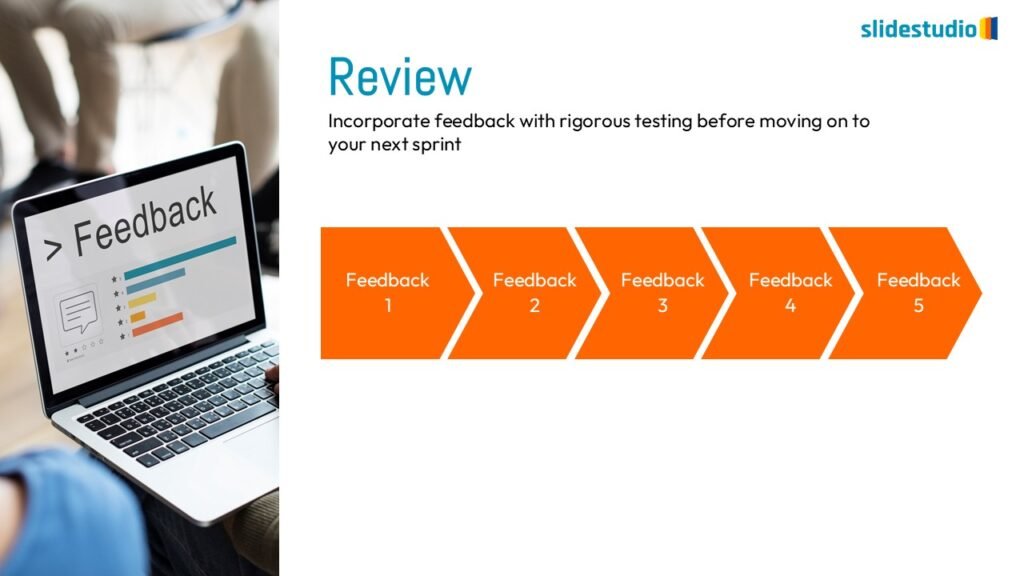
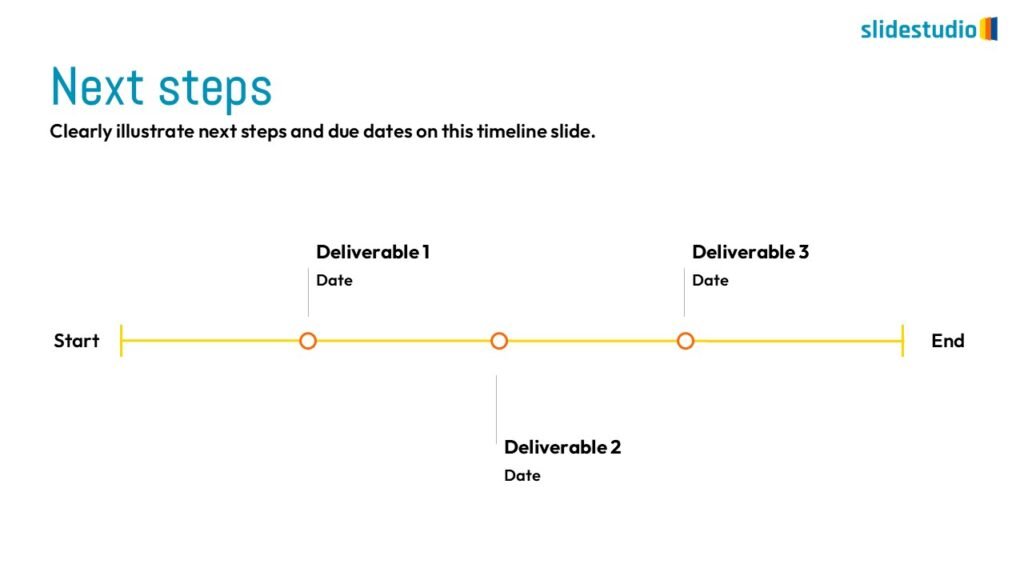
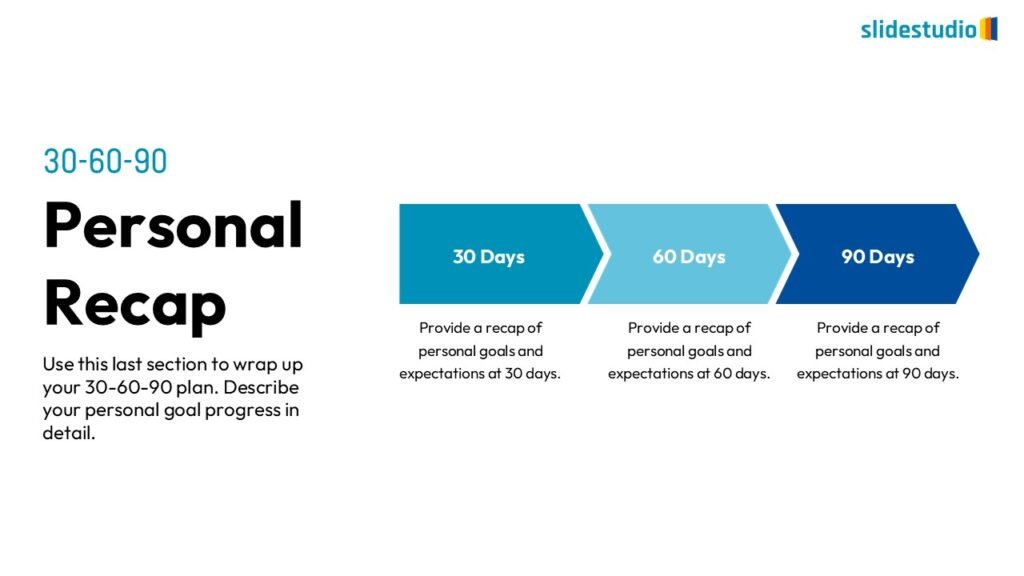
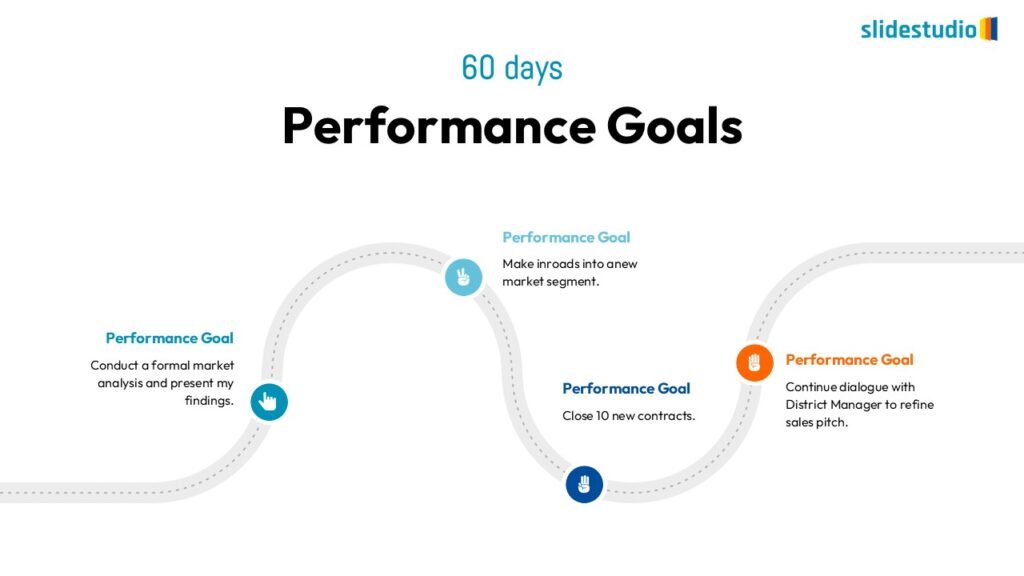
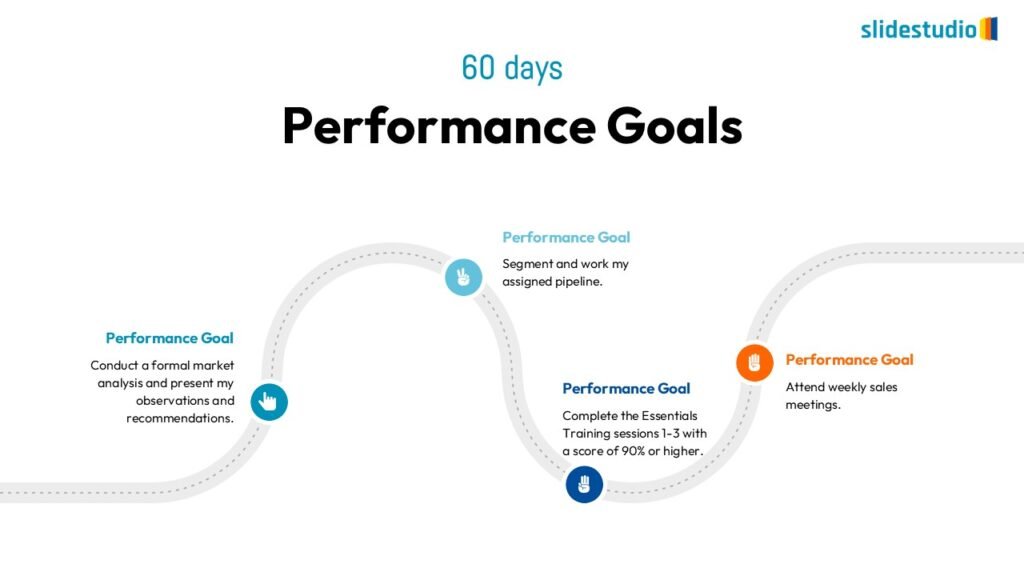
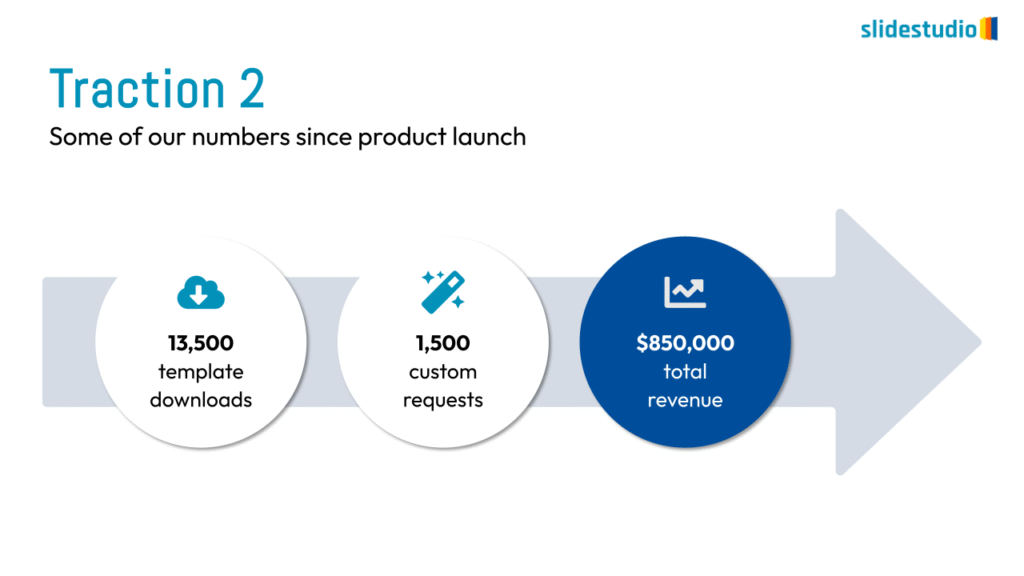
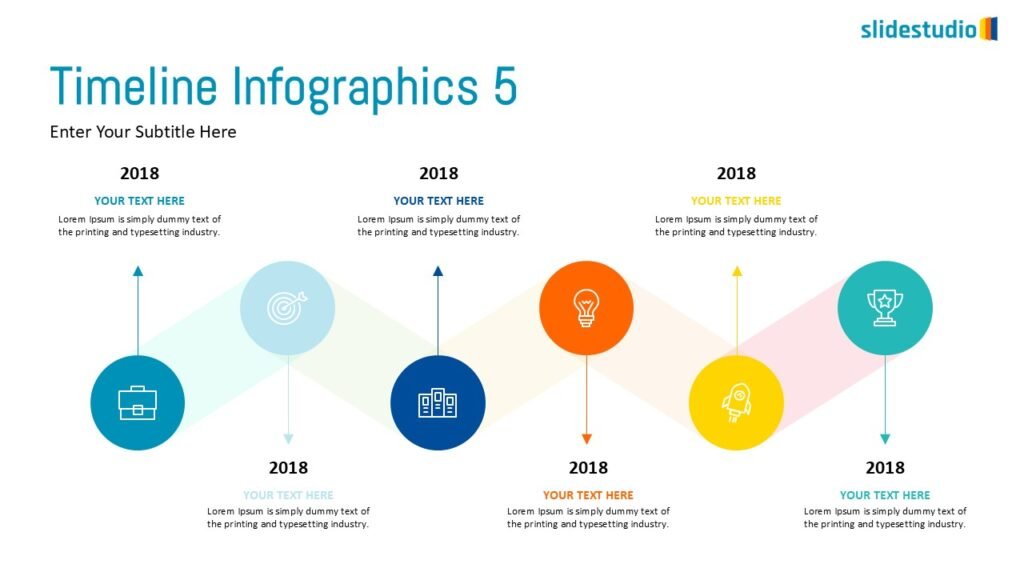
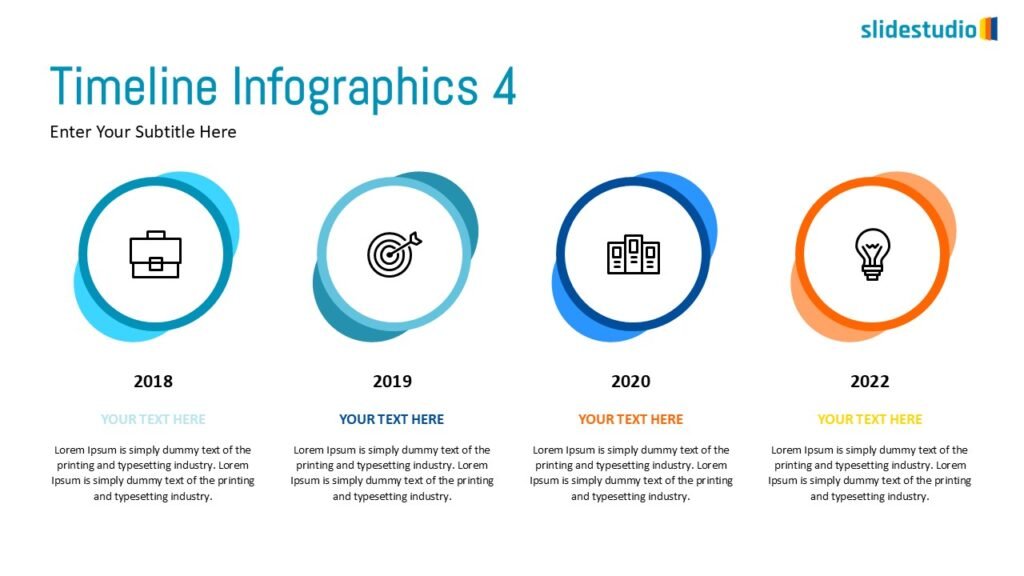
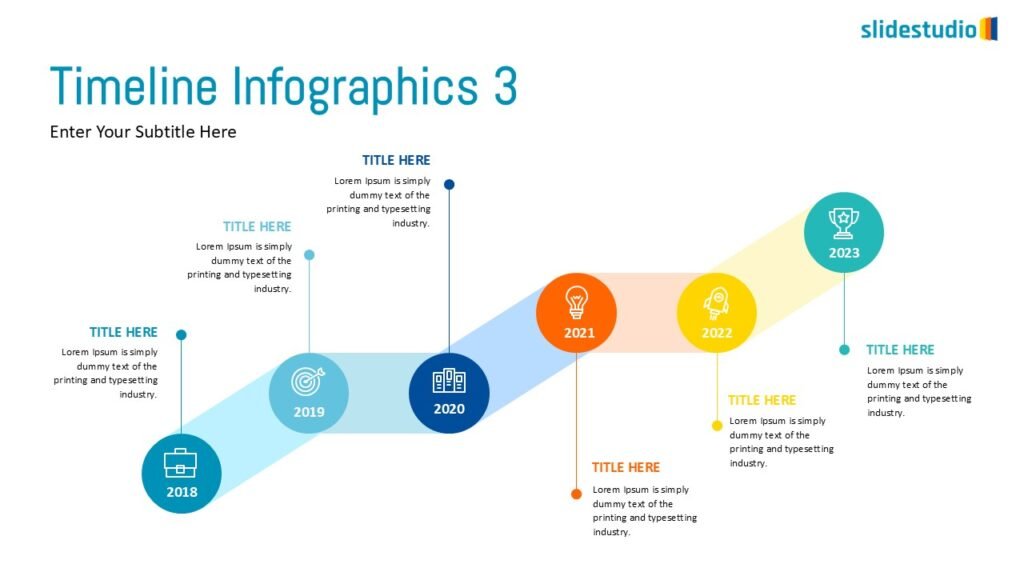
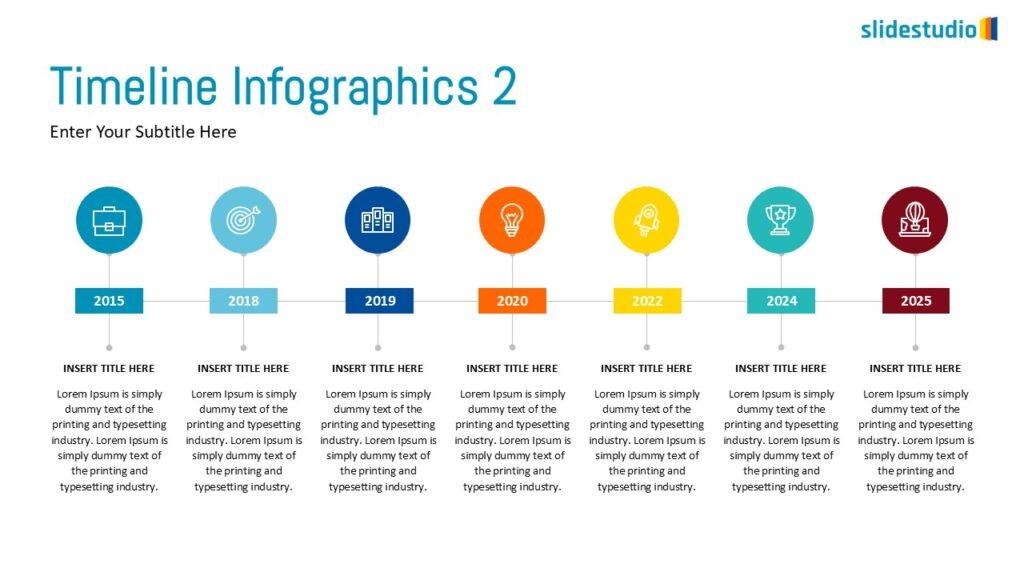
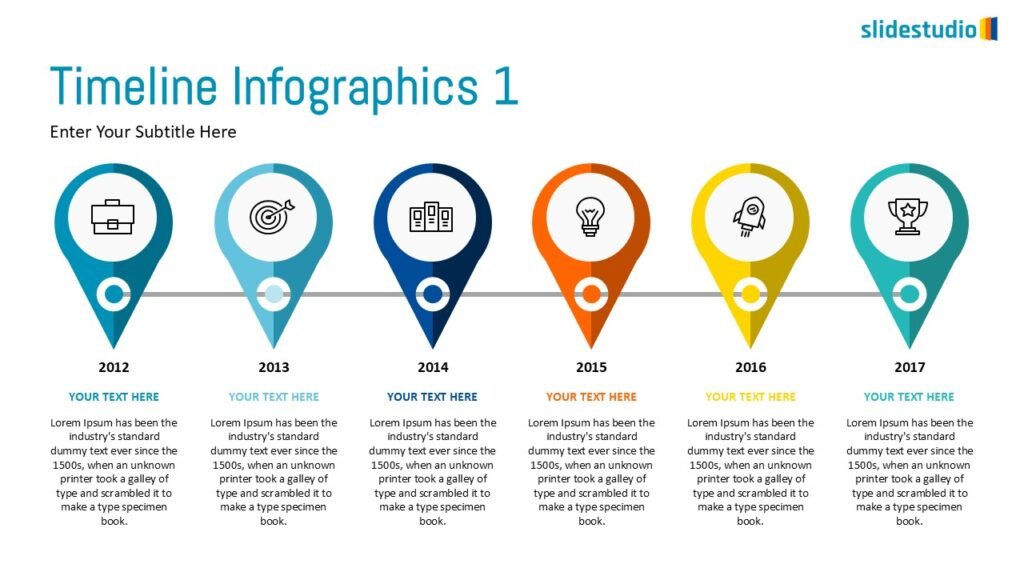
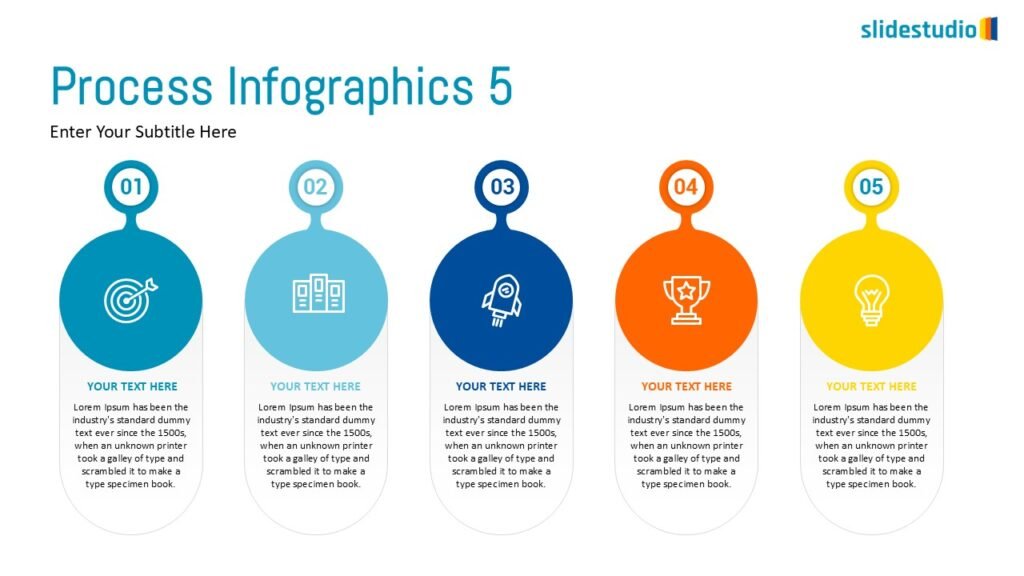
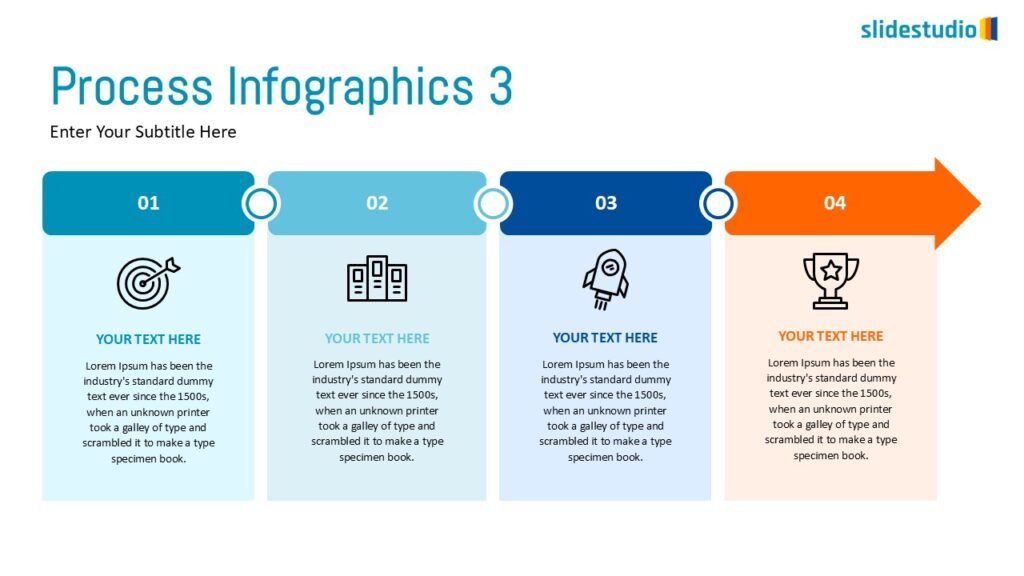
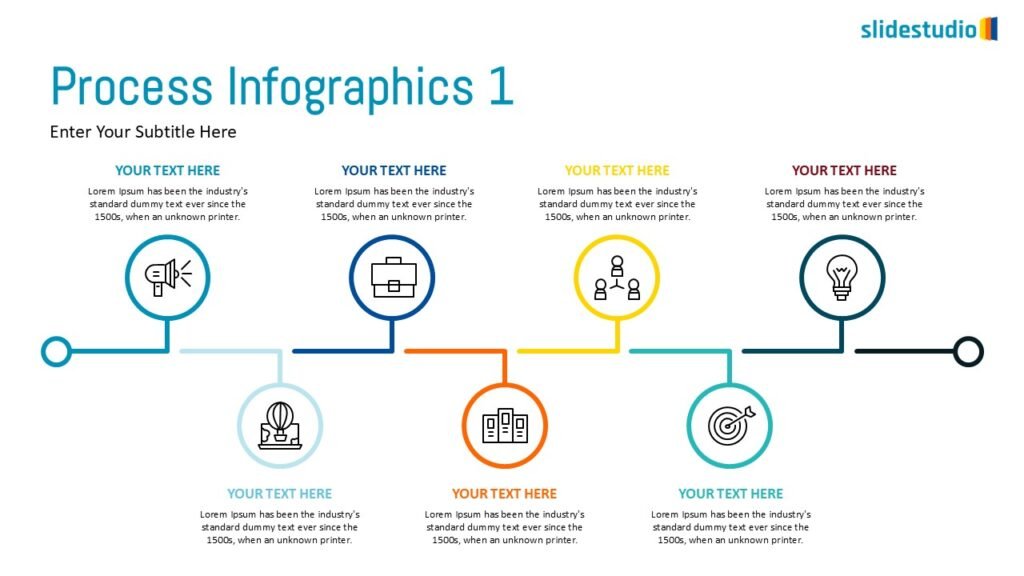
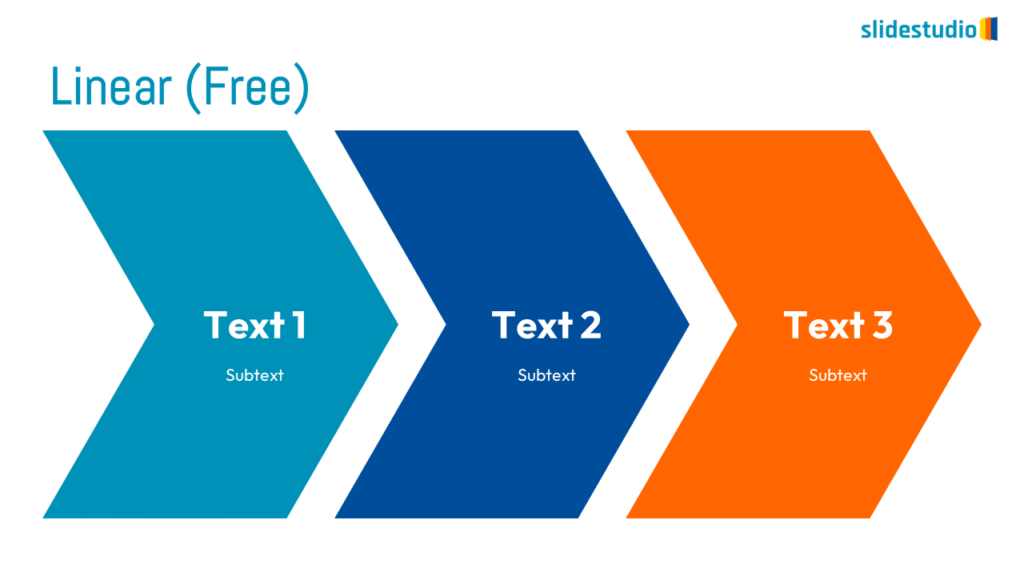
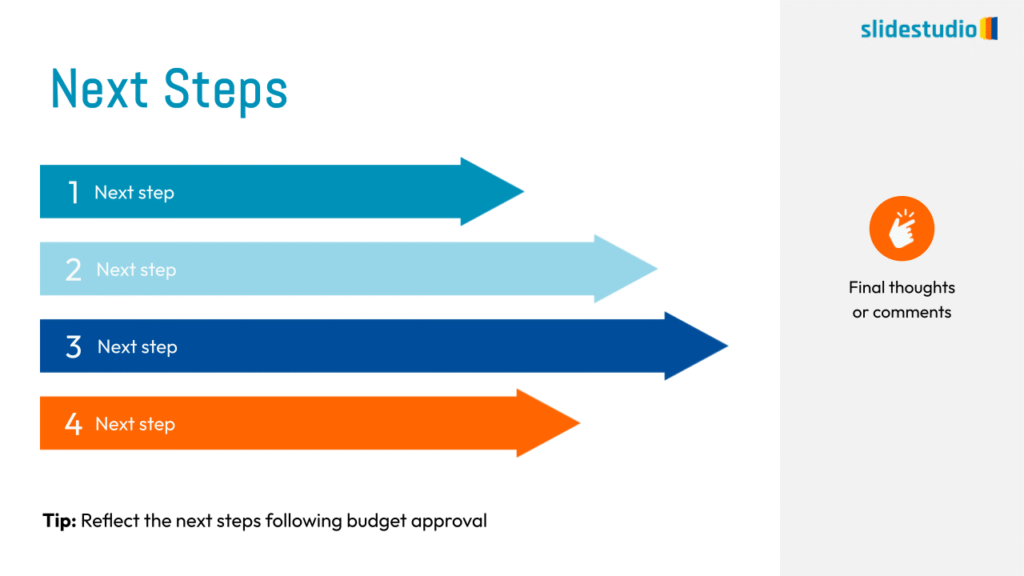
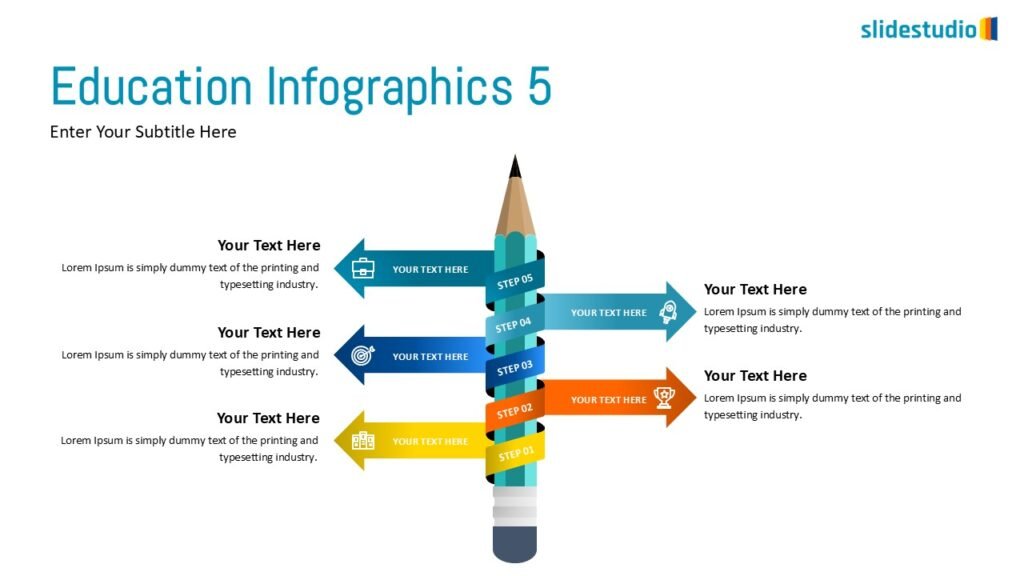
Linear
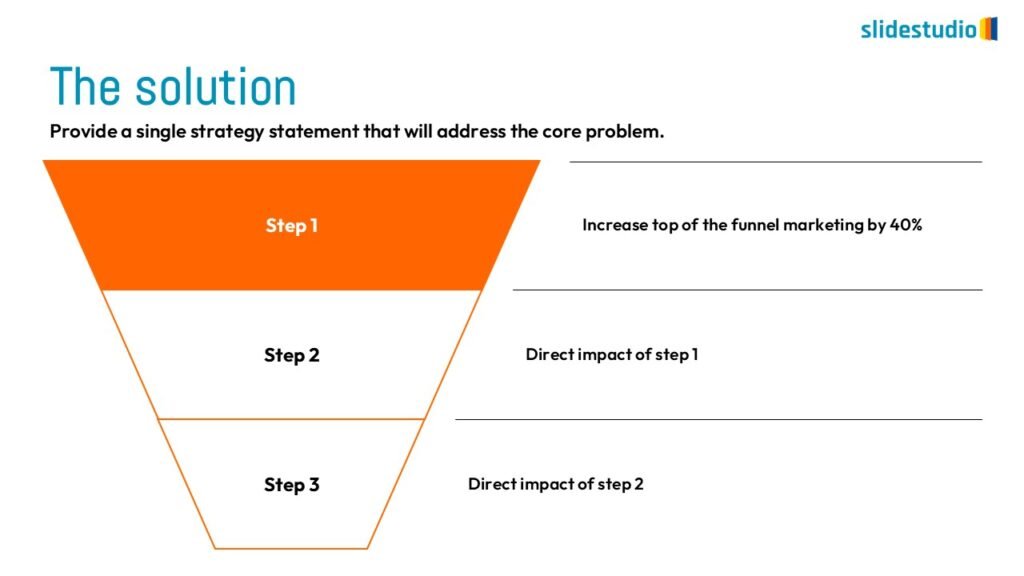
A step-by-step structure that illustrates a straightforward progression from start to finish.
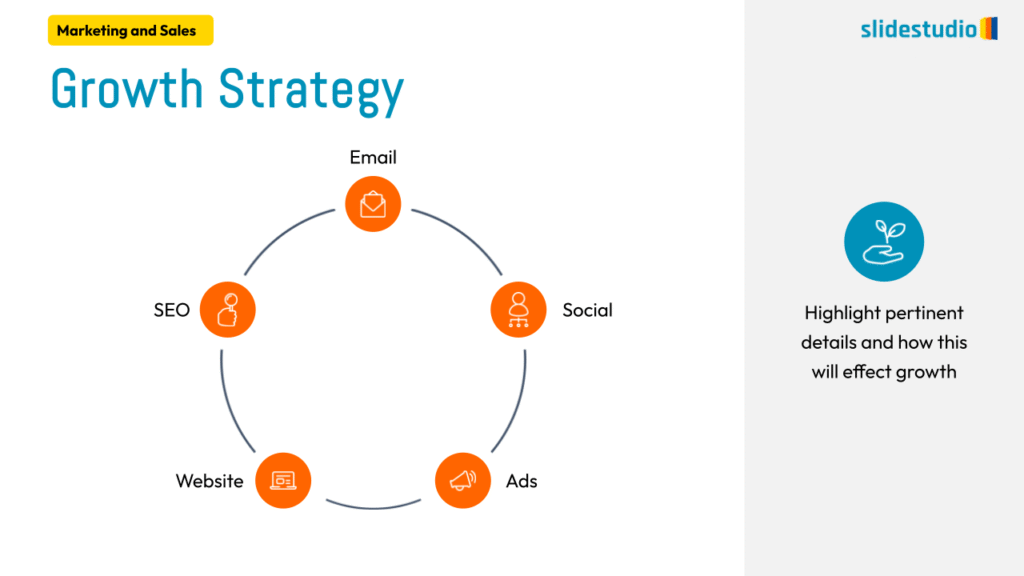
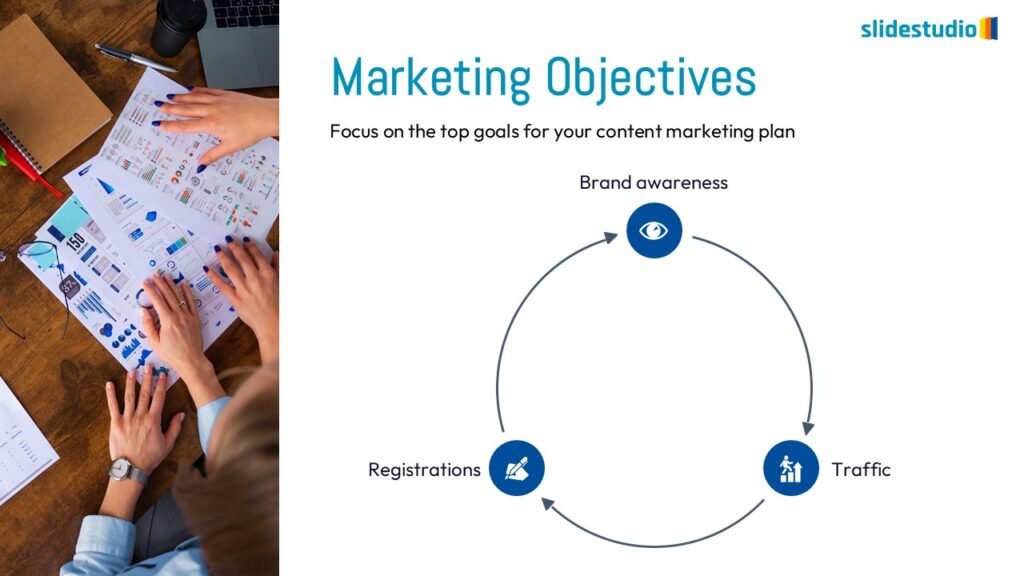
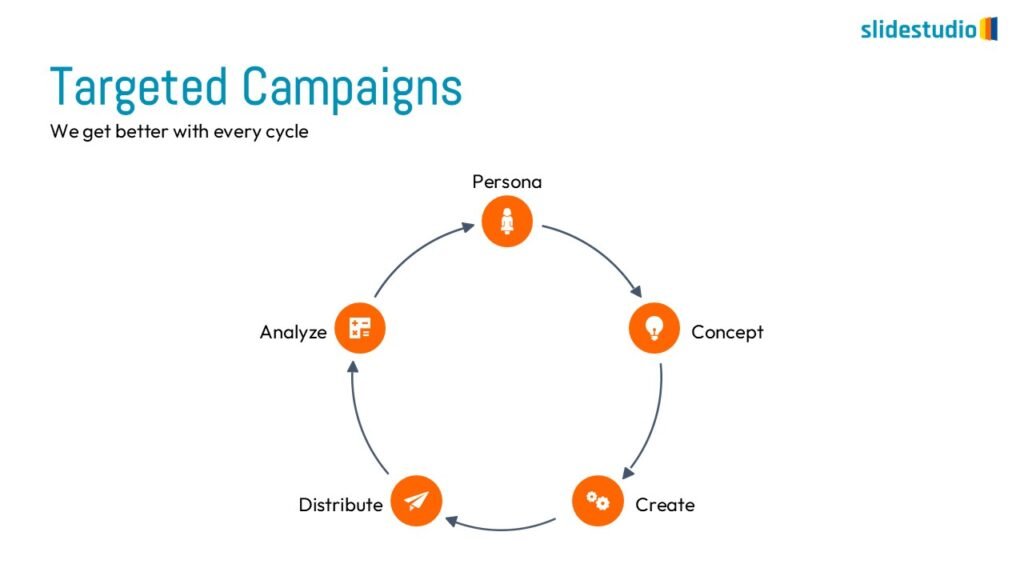
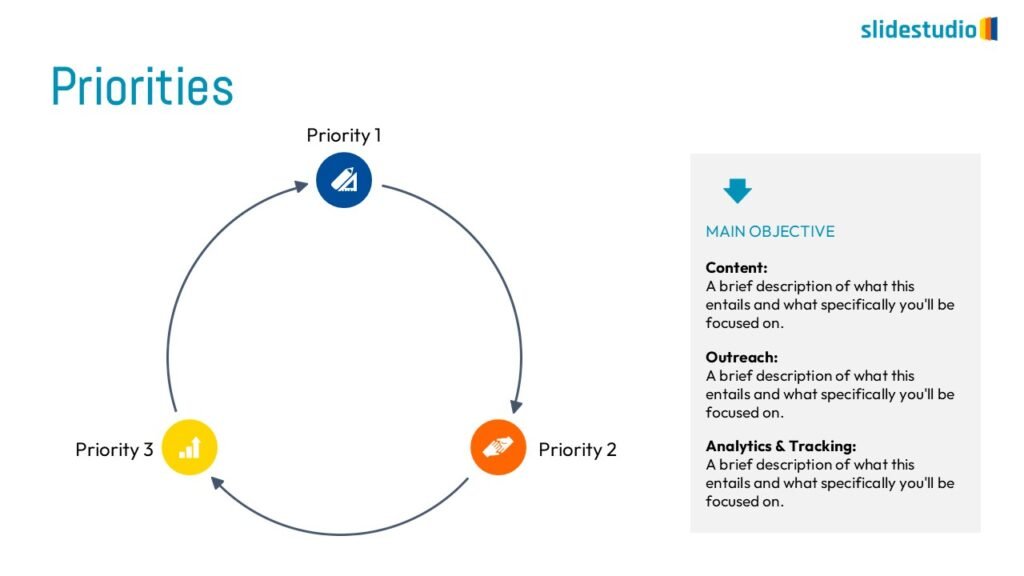
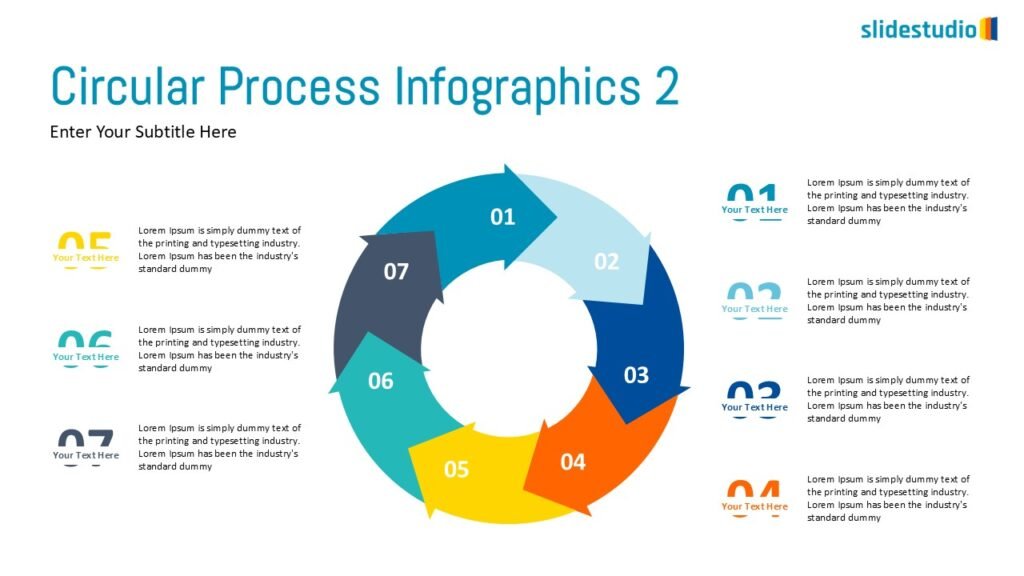
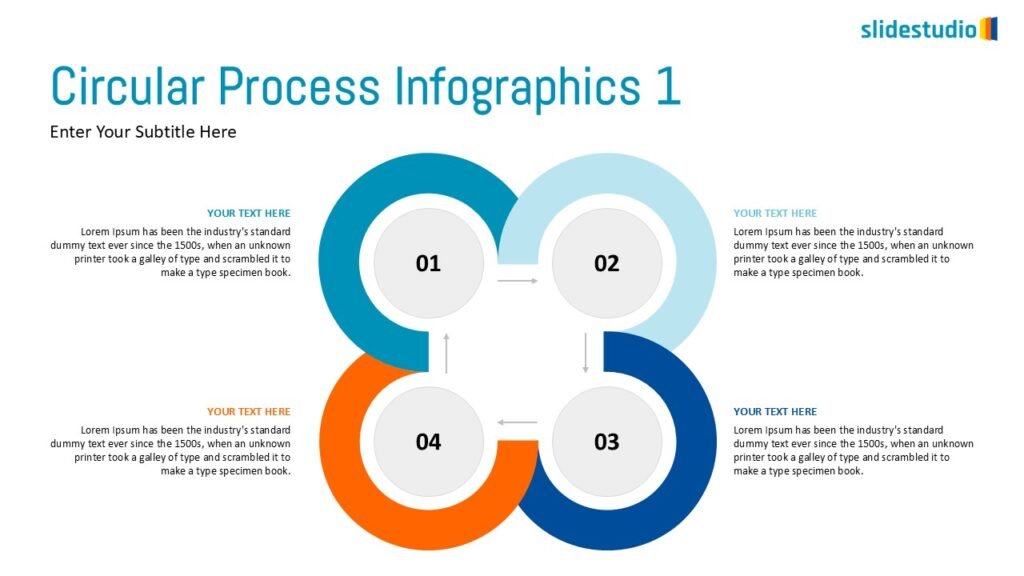
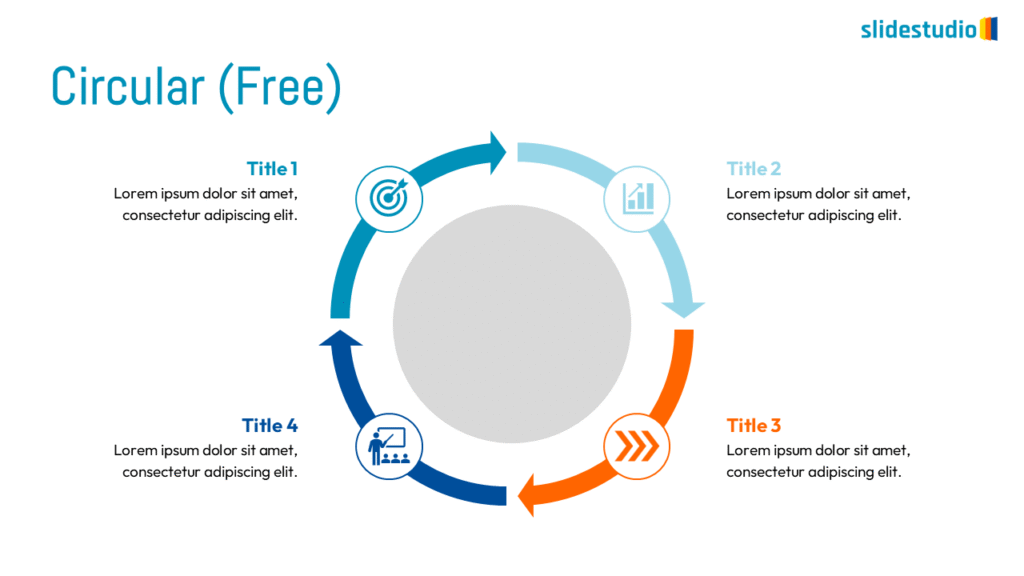
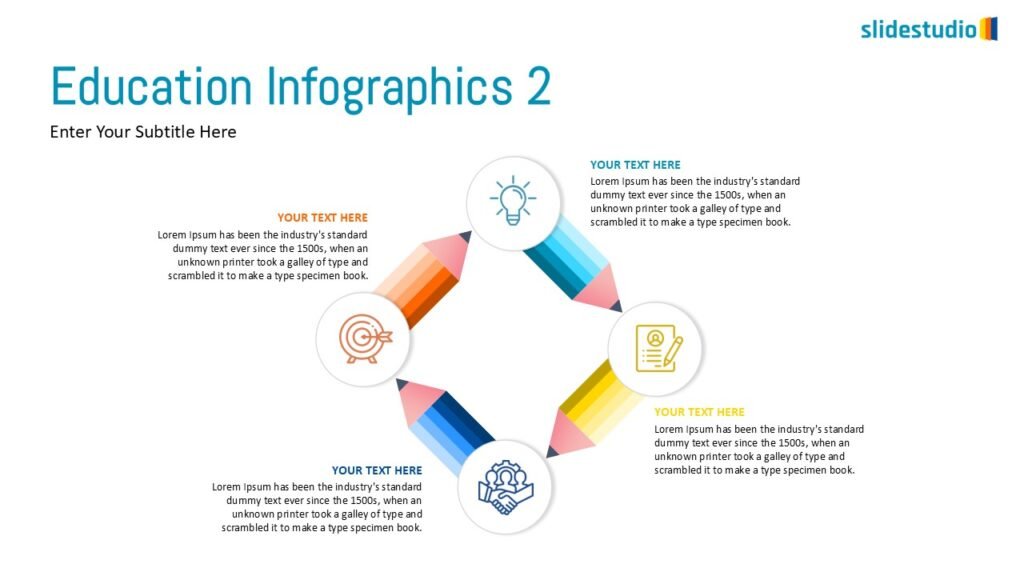
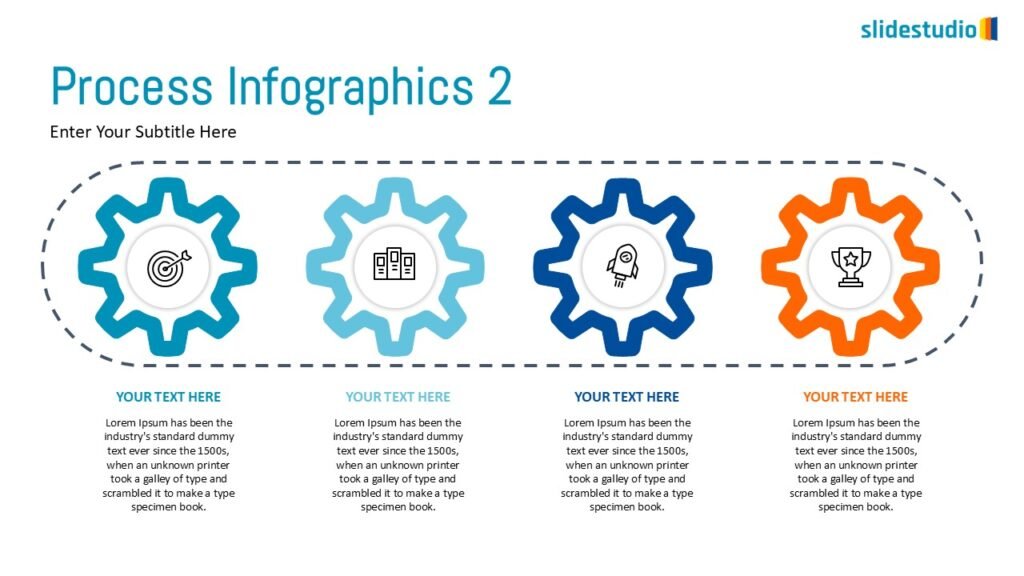
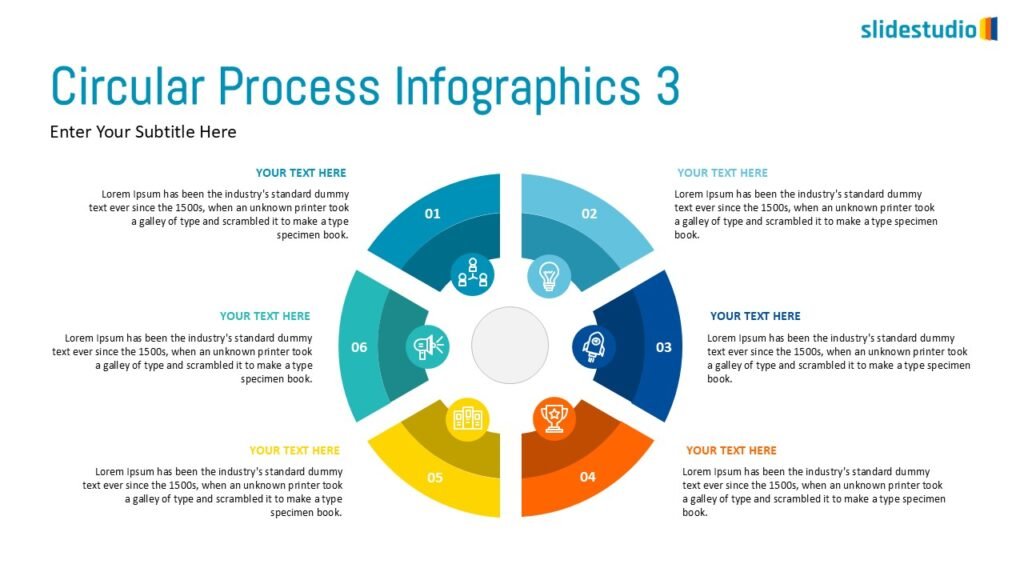
circular
A repeating cycle that effectively conveys continuous processes or feedback loops.
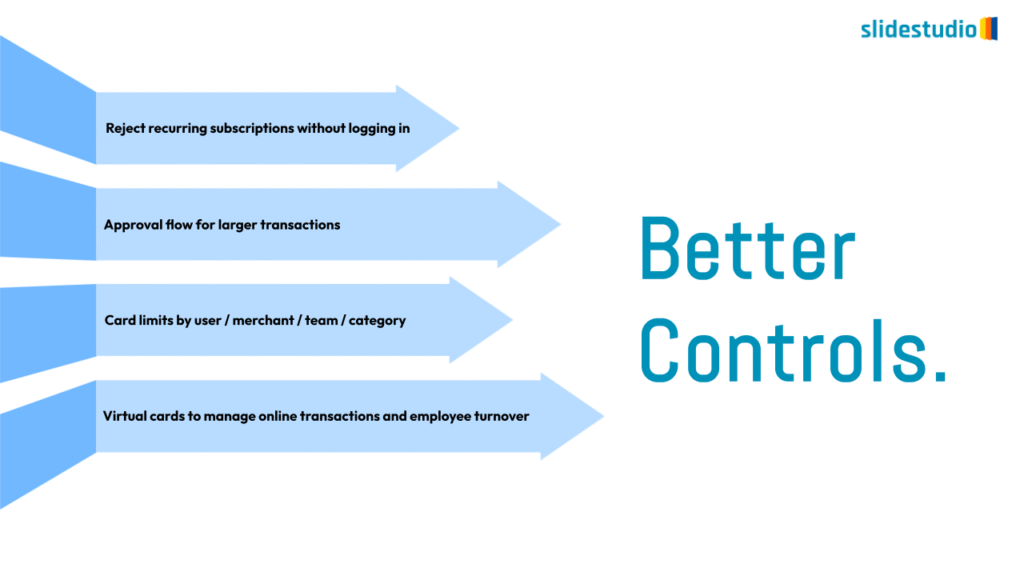
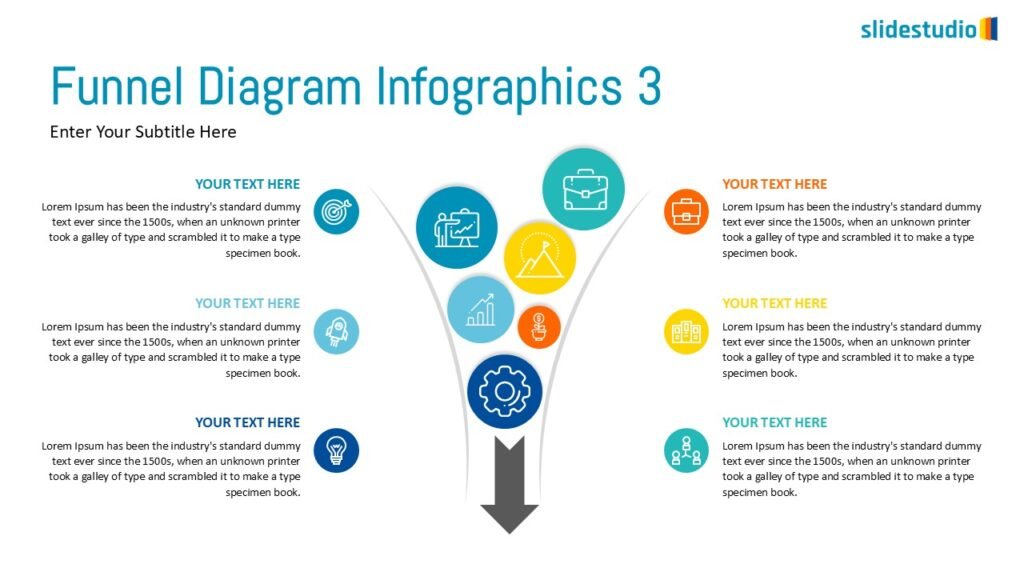
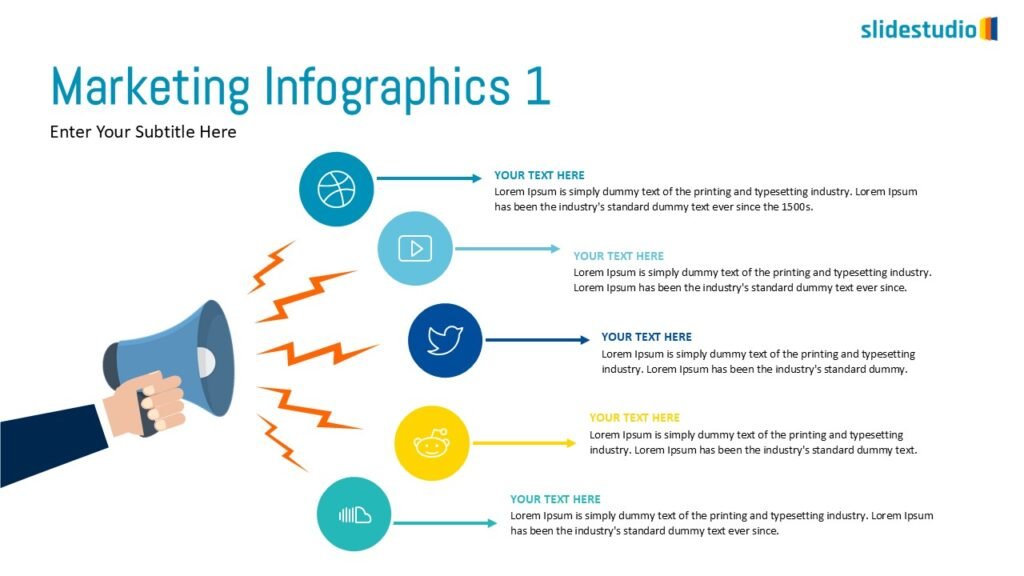
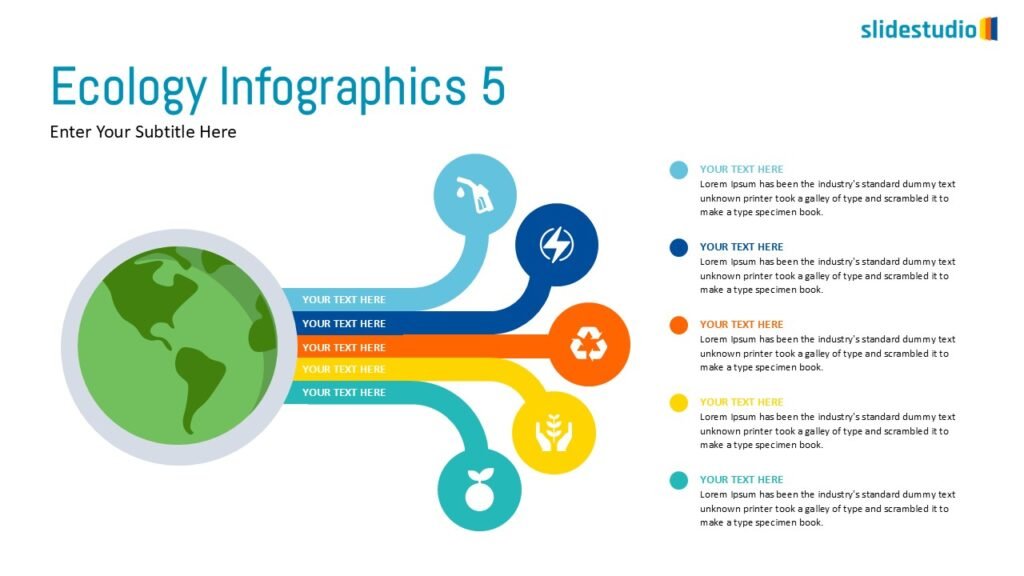
DIVERGENT/CONVERGENT
A flow that branches out or converges, ideal for showing multiple pathways or merging ideas.
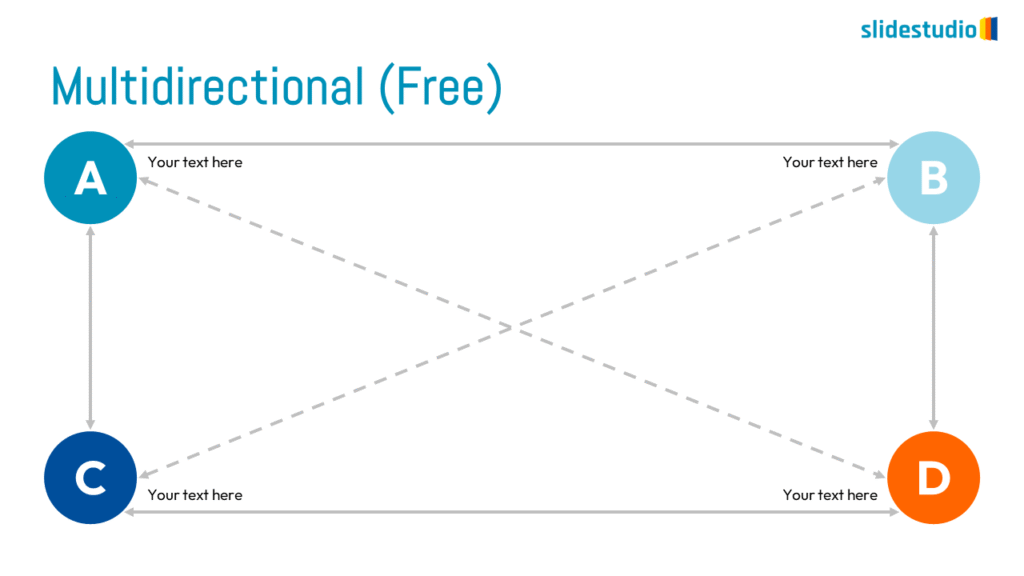
MULTIDIRECTIONAL
A complex structure that allows for movement in multiple directions, useful for networks and interconnected systems.
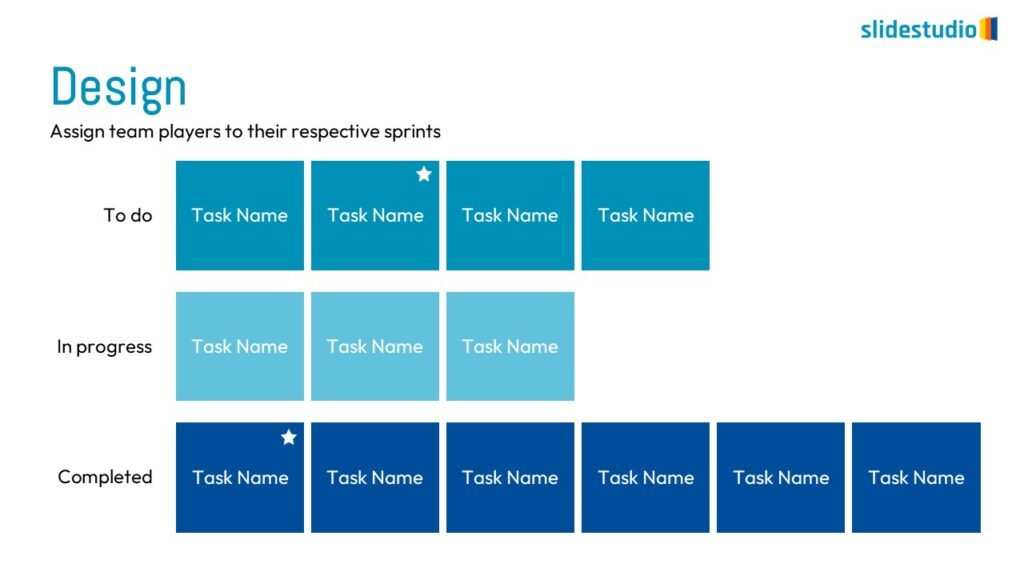
Structure
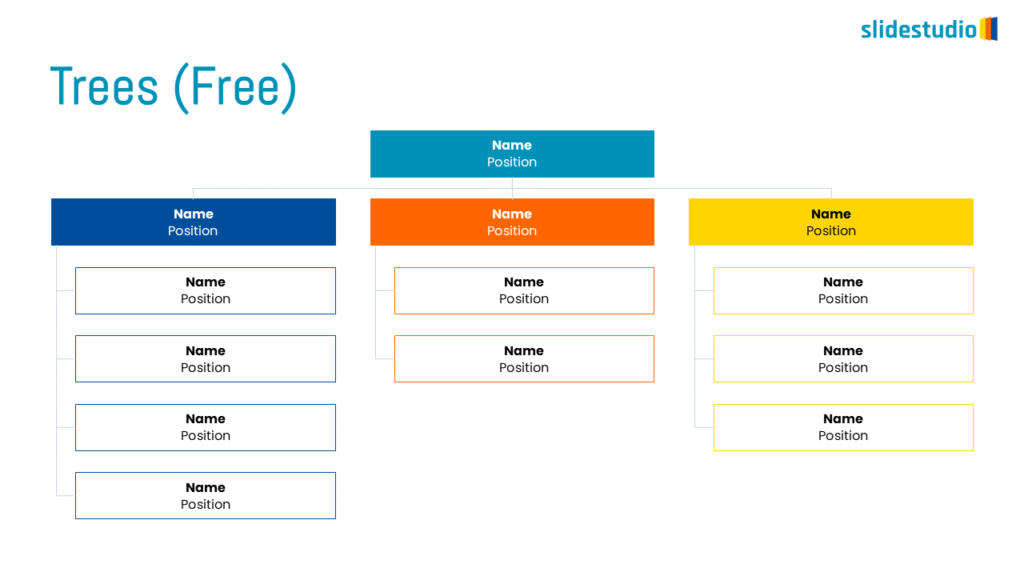
This concept organizes information hierarchically or categorically, often using matrices, trees, or layered arrangements. It helps to present the framework or arrangement of components within a system or process.
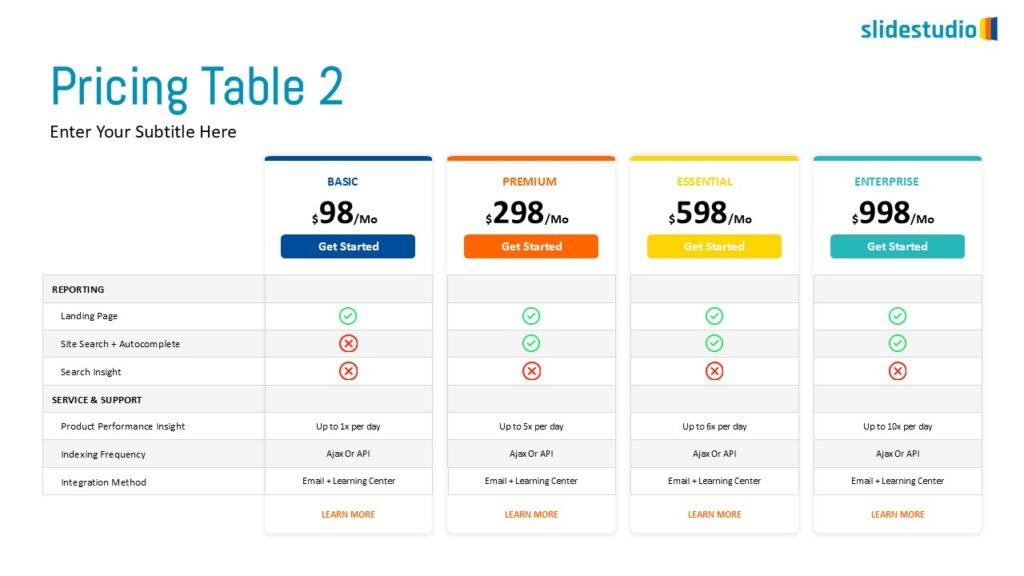
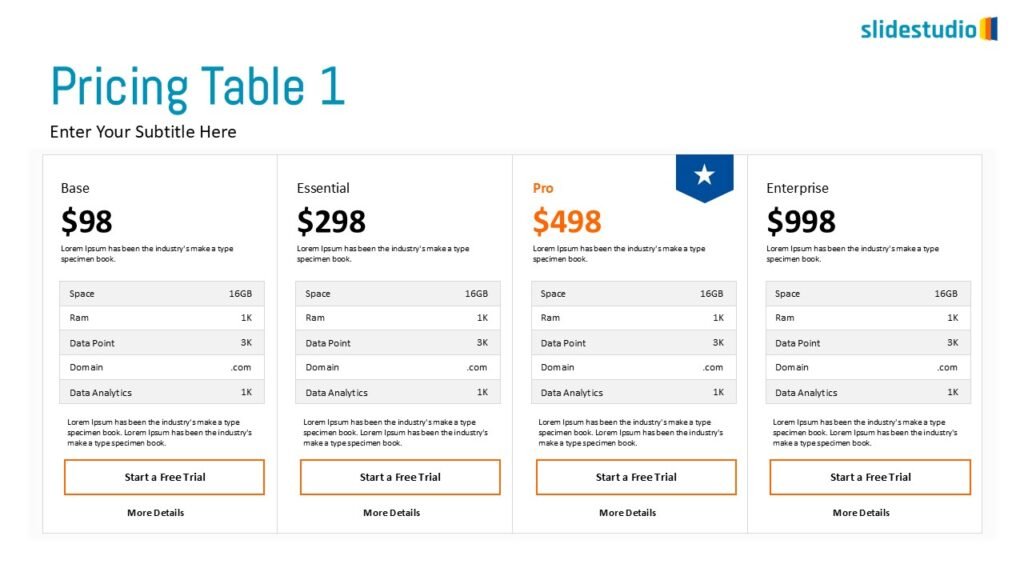
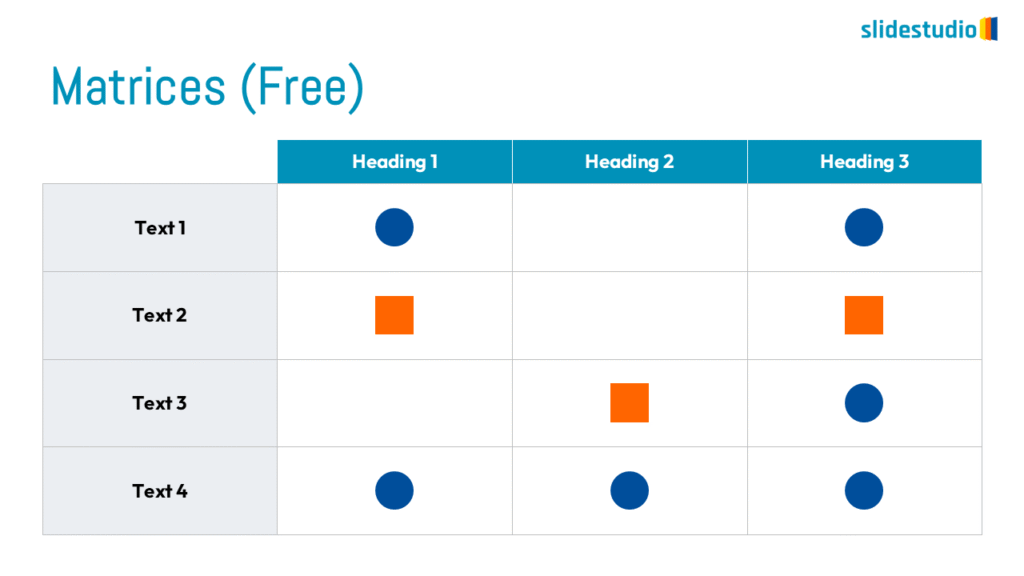
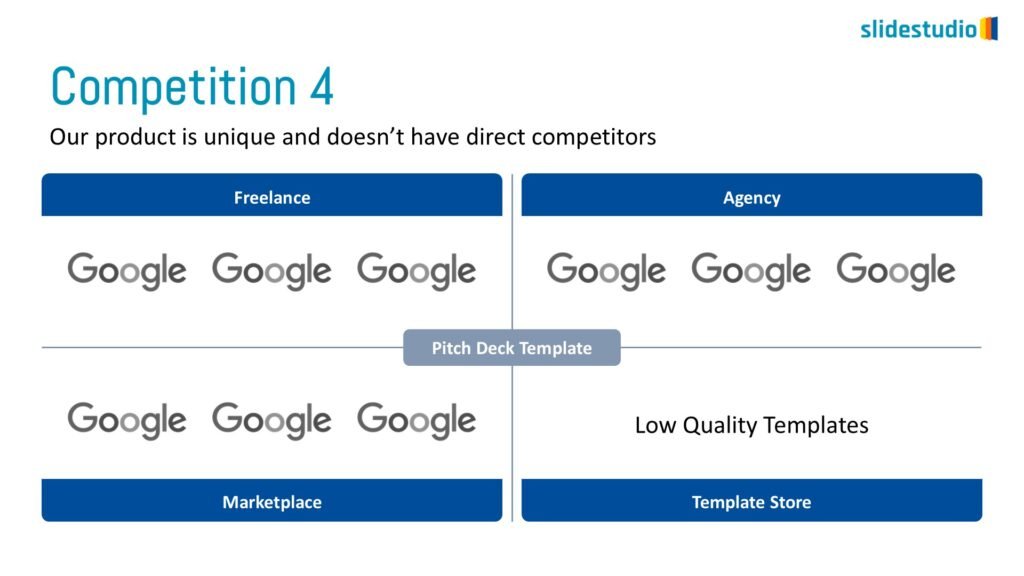
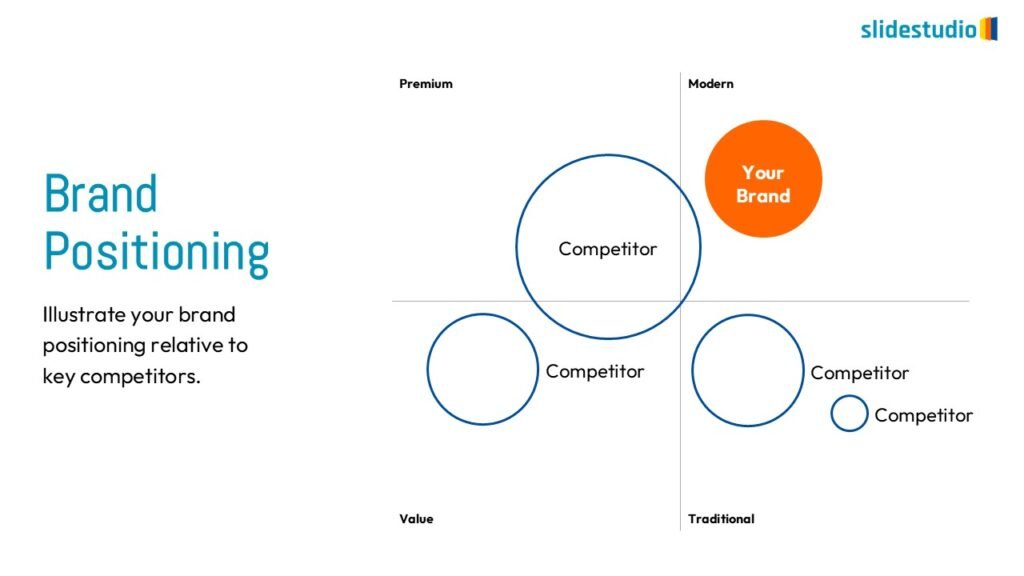
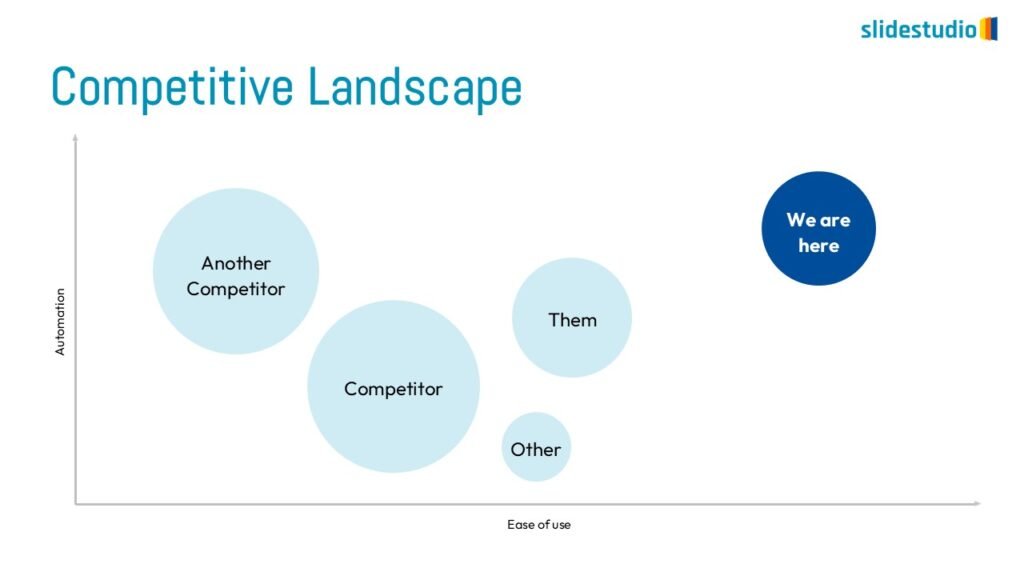
MATRICES
A grid format that compares information across categories or dimensions side-by-side.
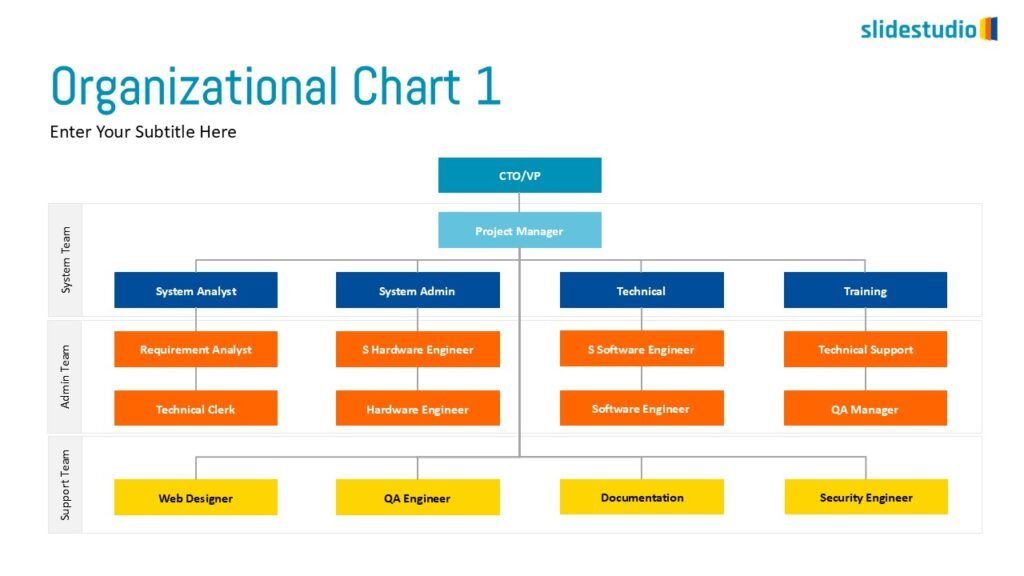
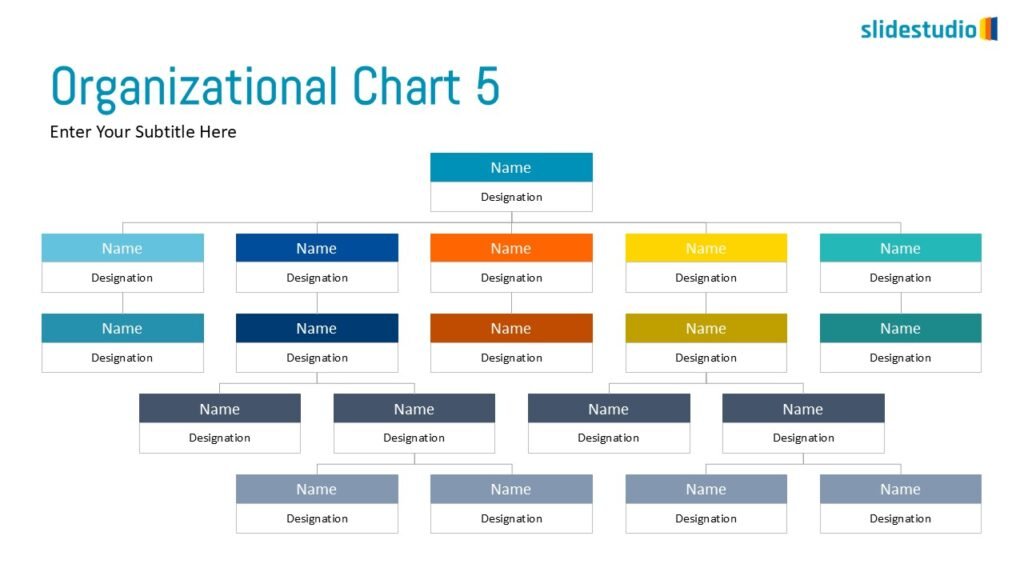
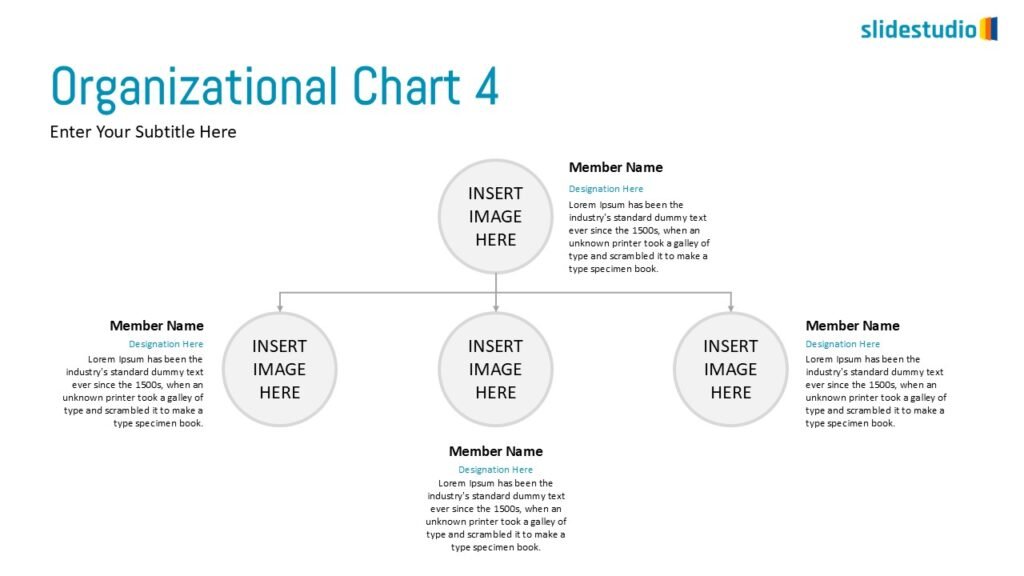
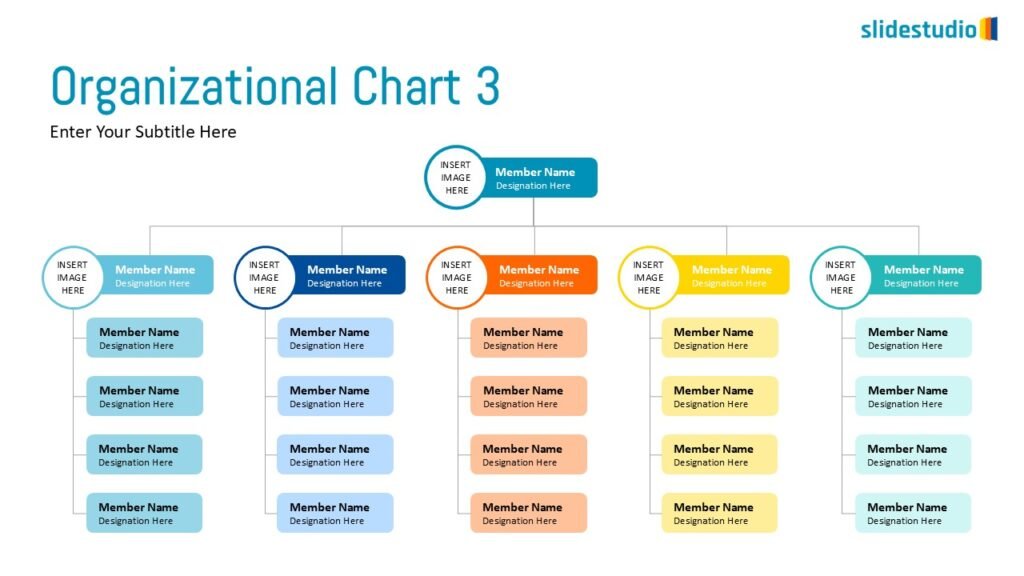
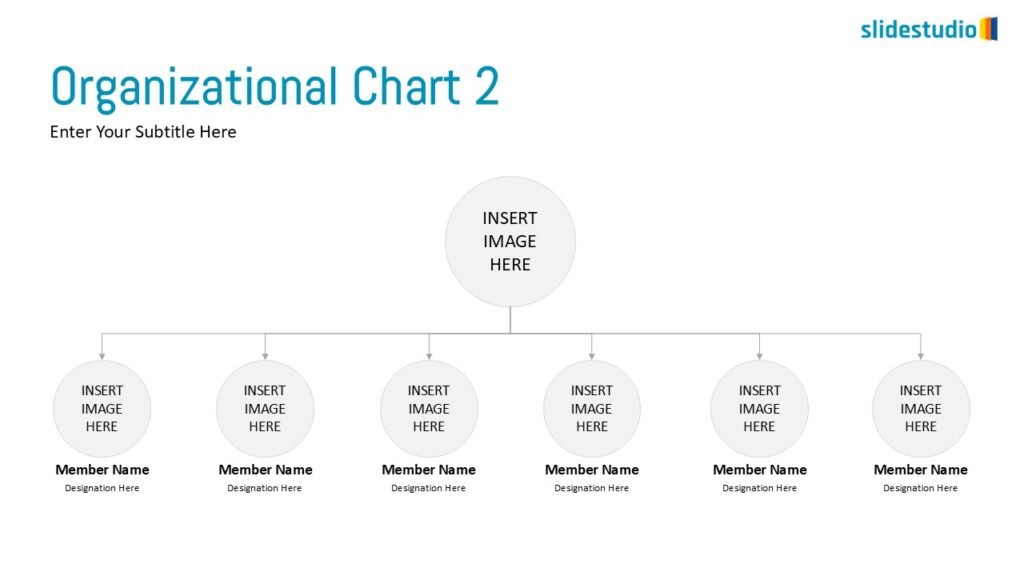
TREES
A hierarchical layout that maps out connections, such as organizational charts or family trees.
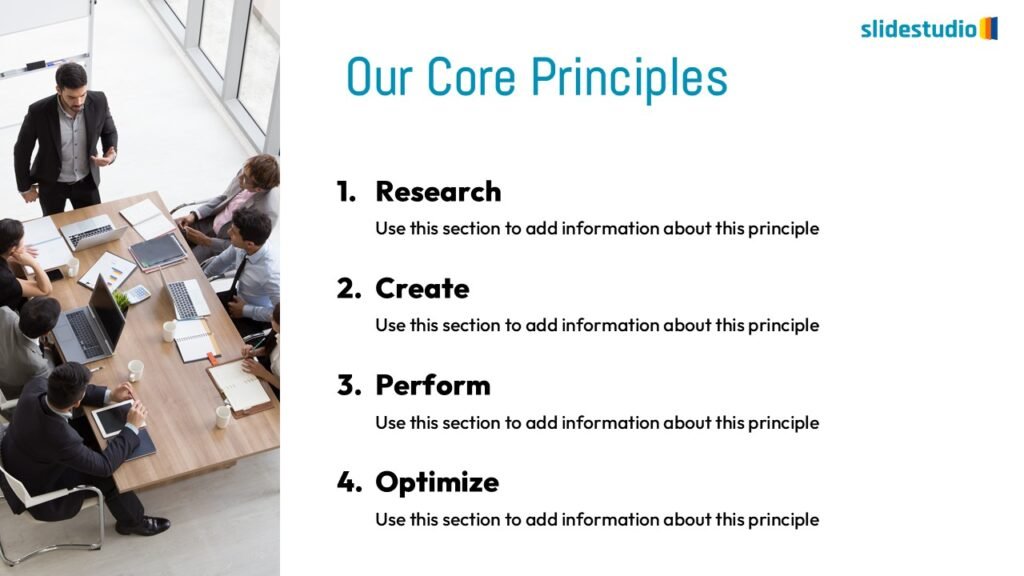
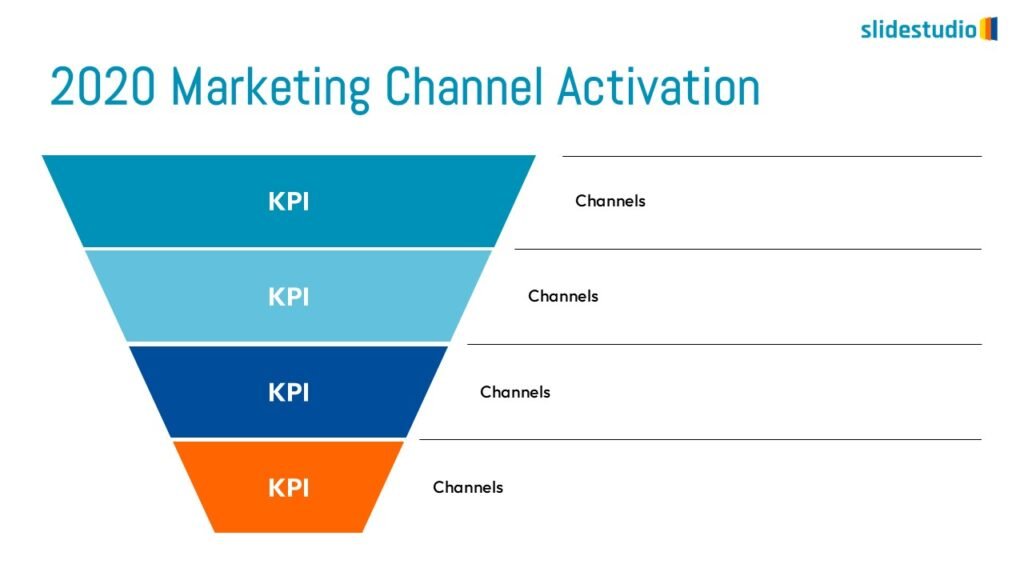
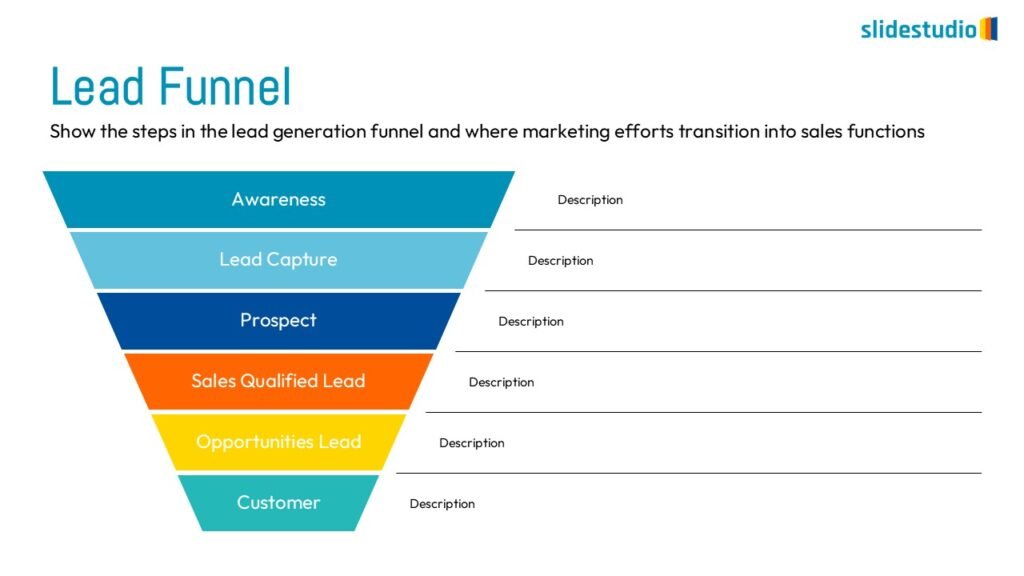
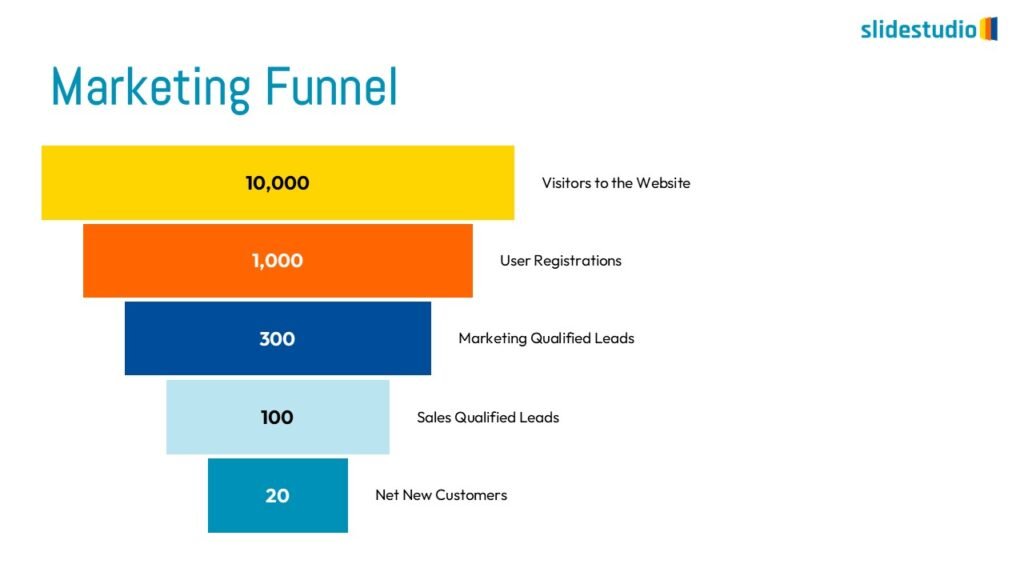
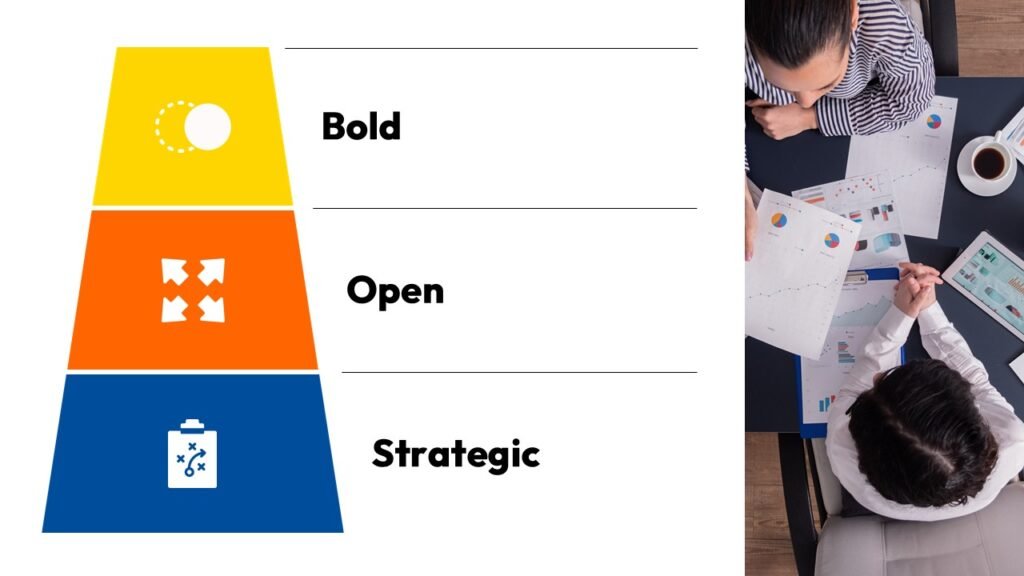
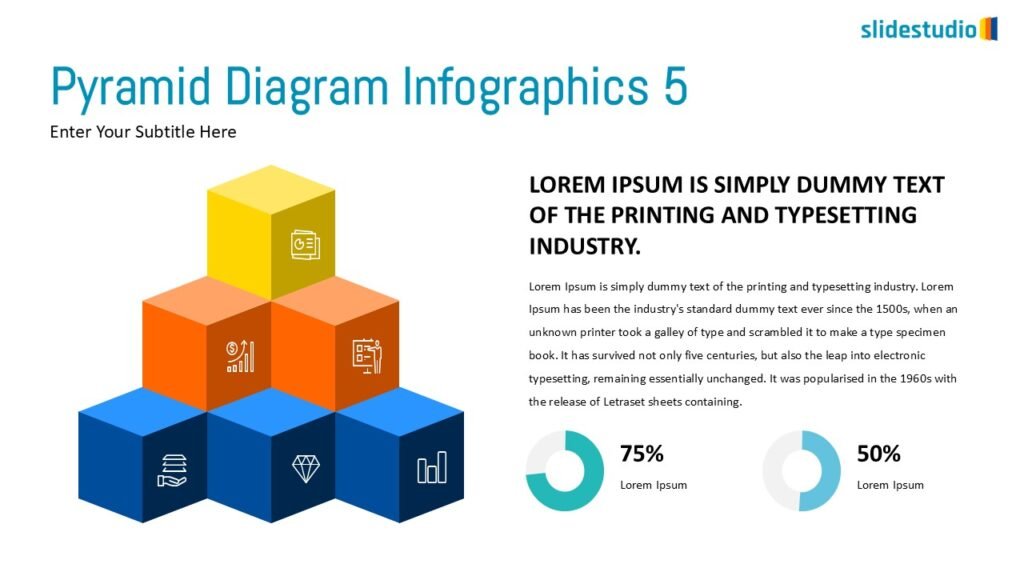
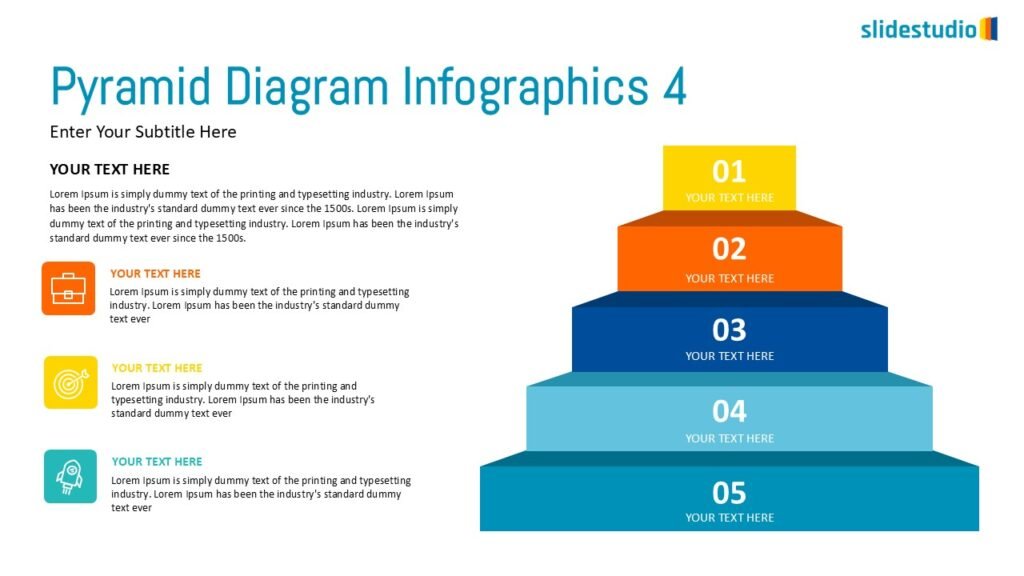
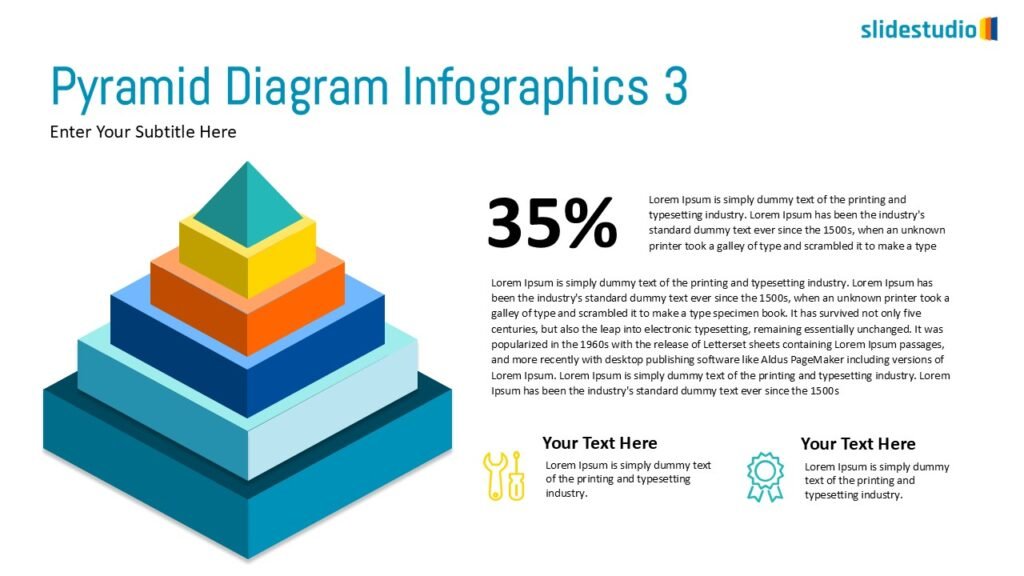
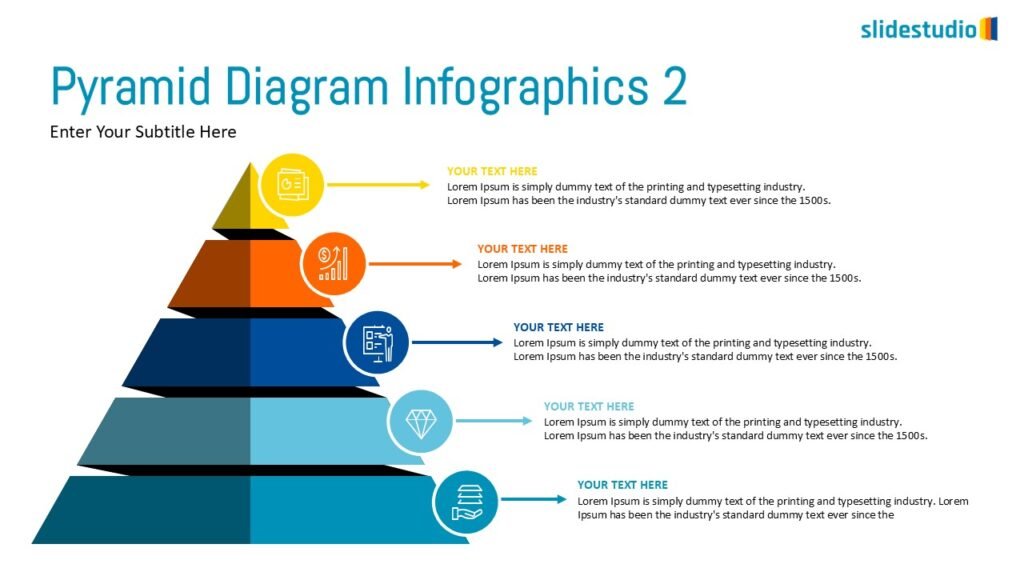
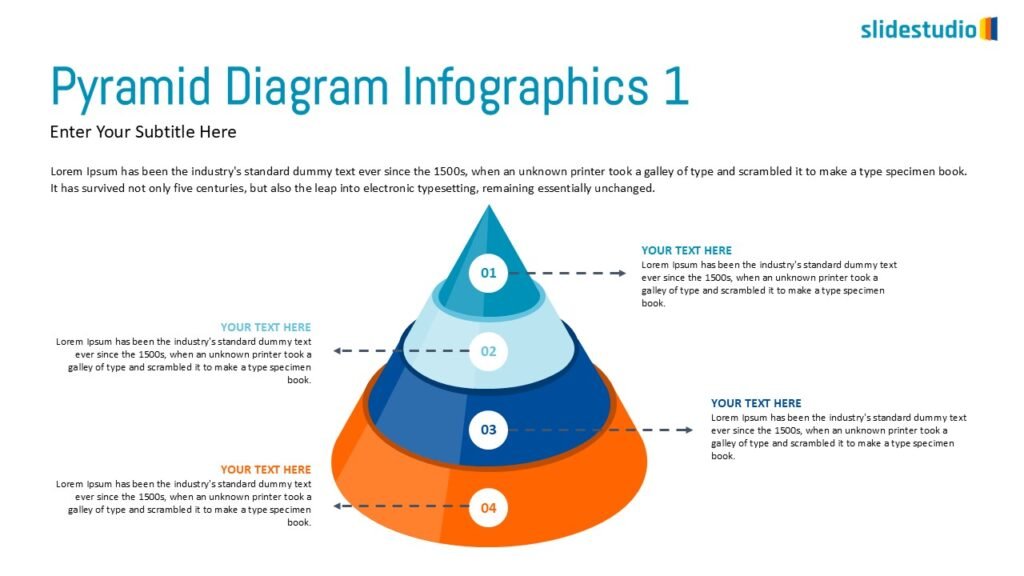
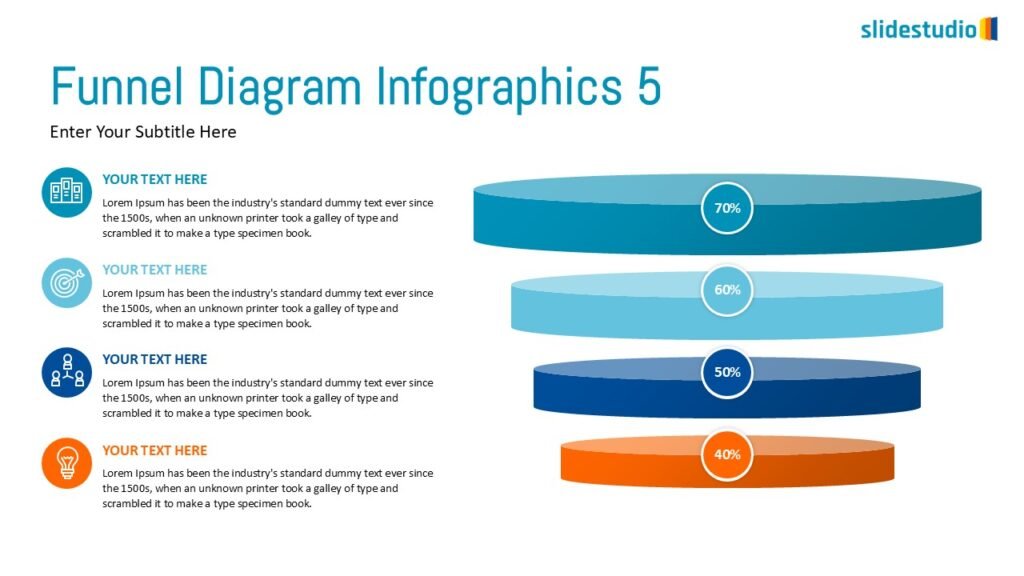
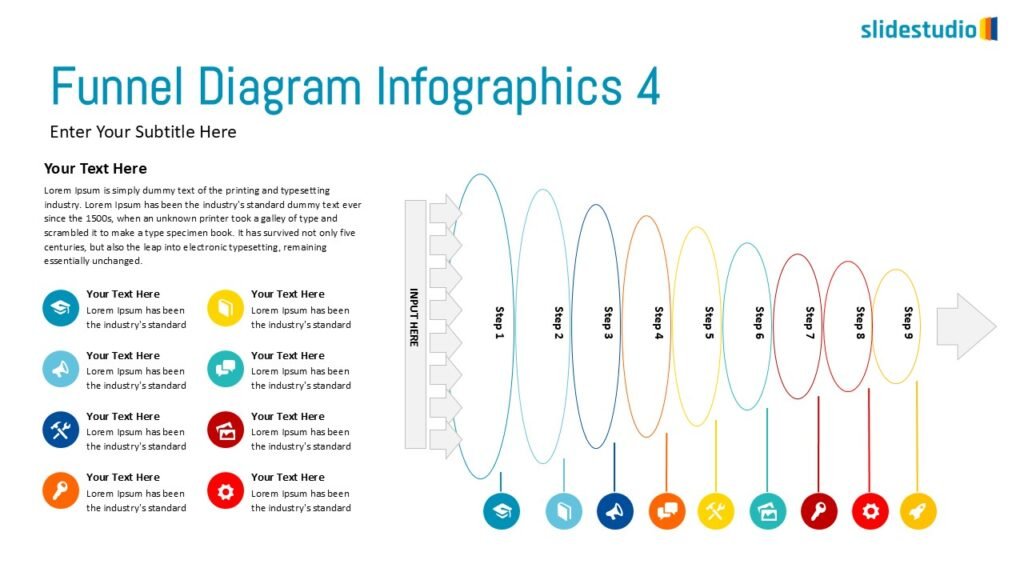
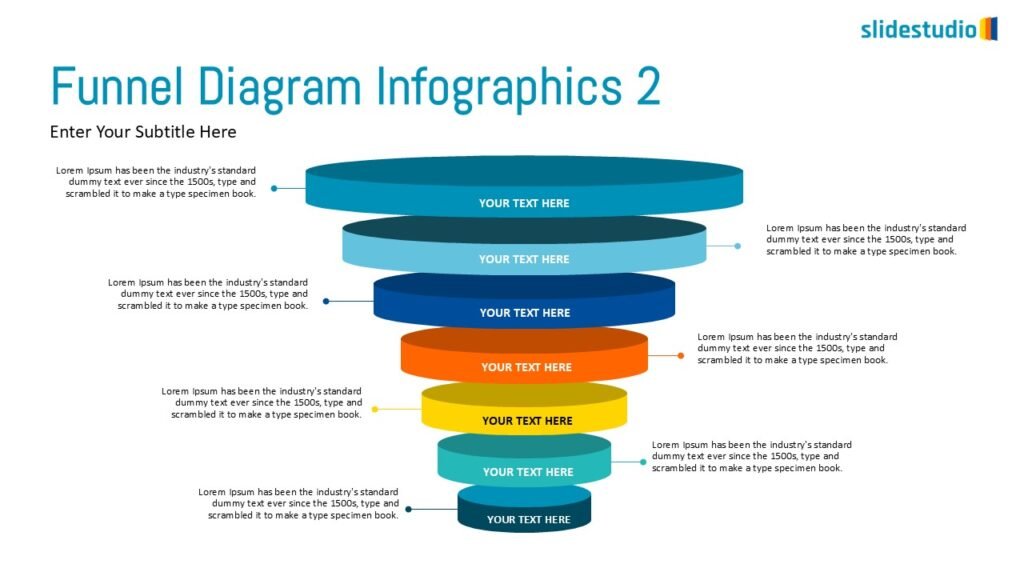
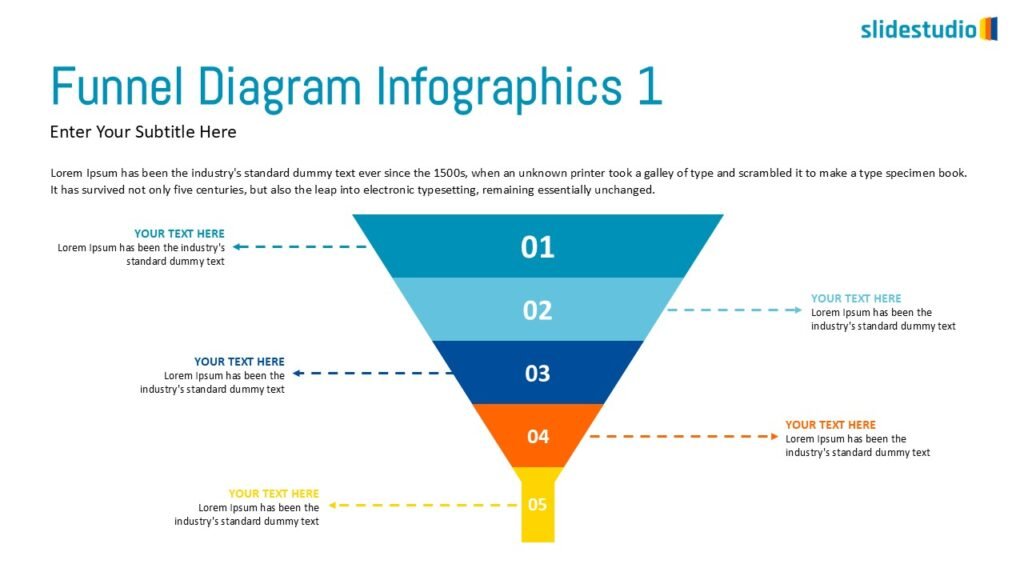
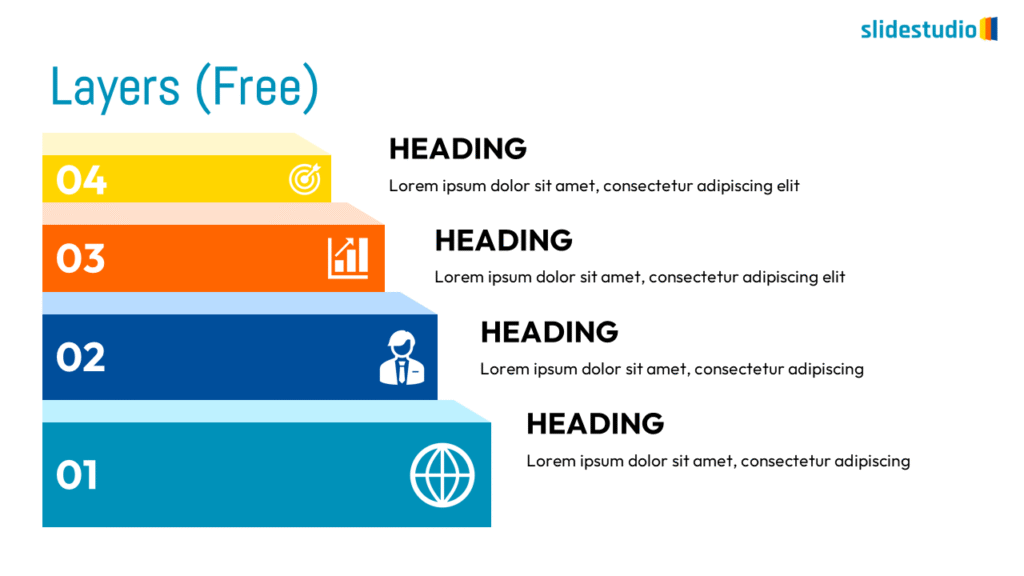
LAYERS
A stacked structure that shows tiered information, with each layer building upon the previous one.
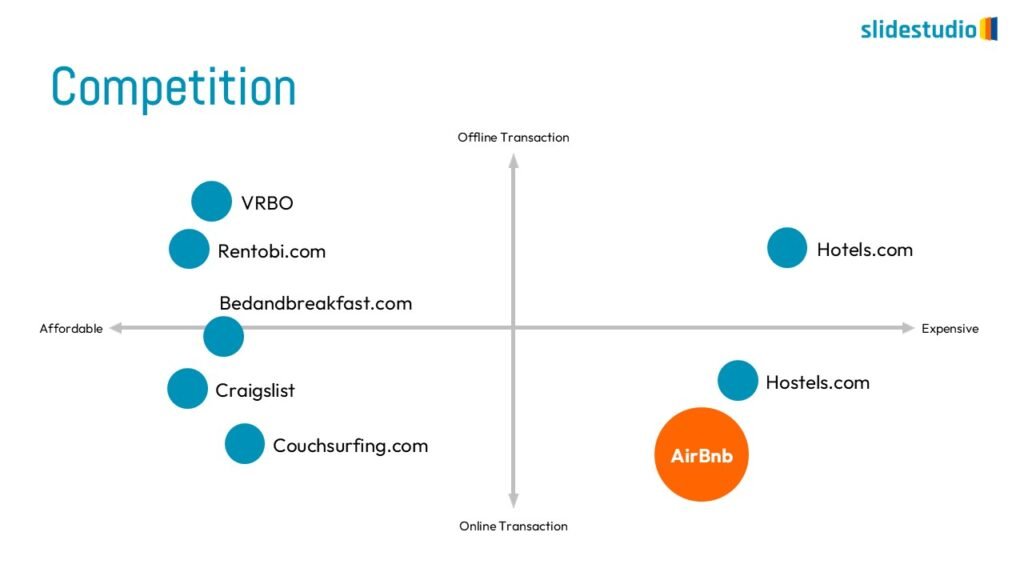
Cluster
This concept visually groups related items together, showing associations or overlaps. Cluster designs c to represent elements that belong together within a context or theme.
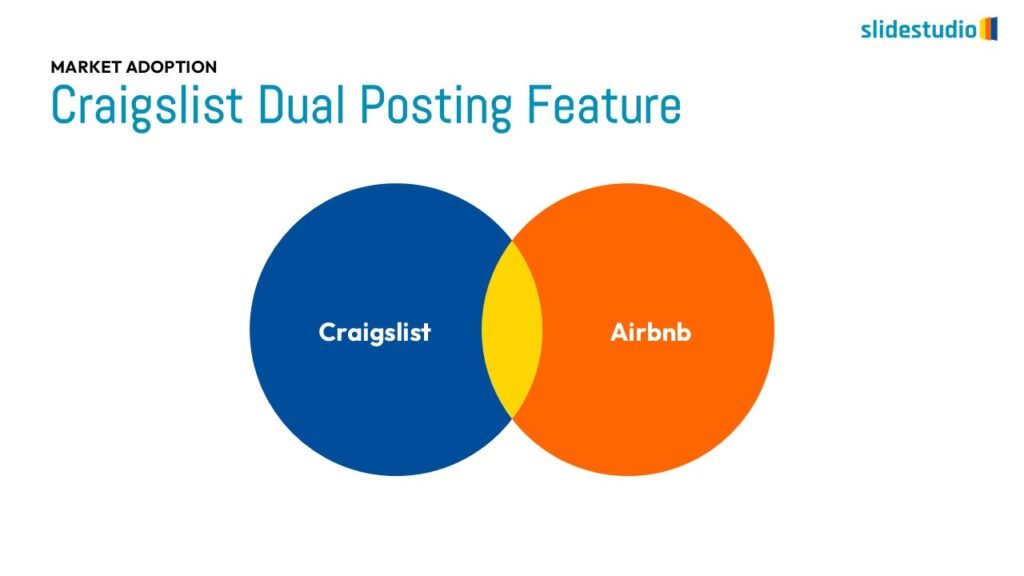
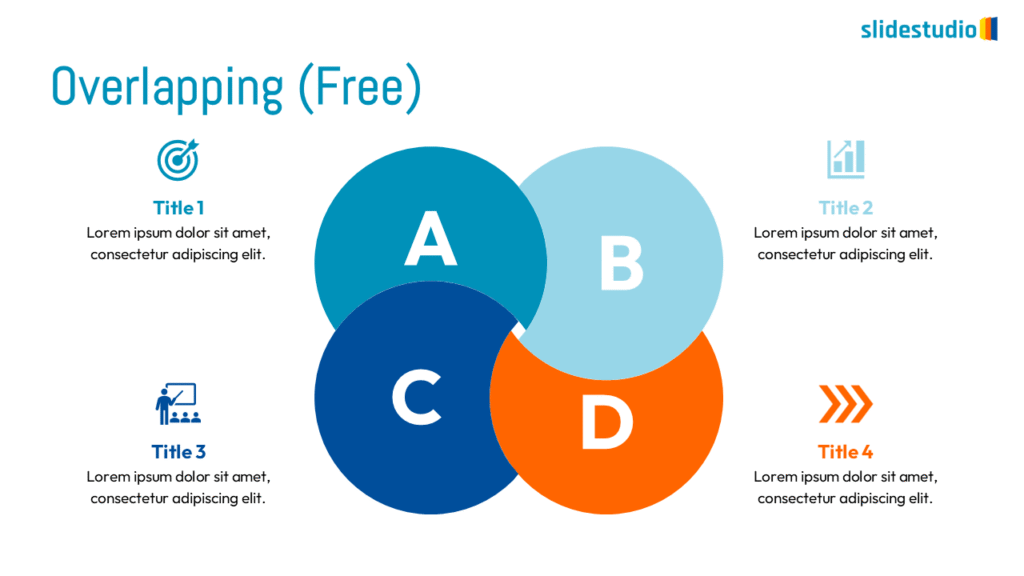
OVERLAPPING
Displays shared areas or intersections, useful for showing commonalities in Venn diagrams.
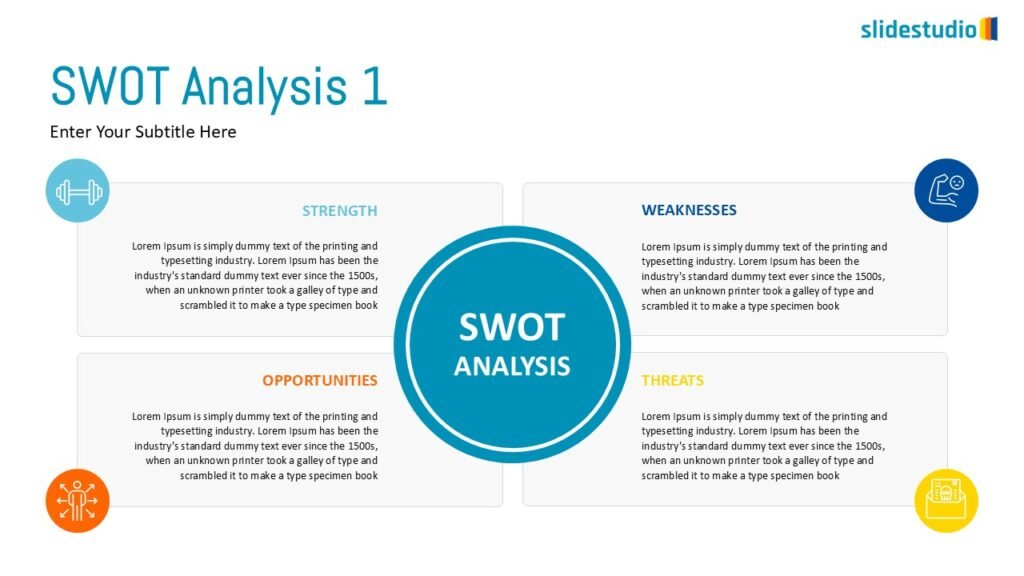
CLOSURE
Groups elements within a boundary to create unity and emphasize connection.
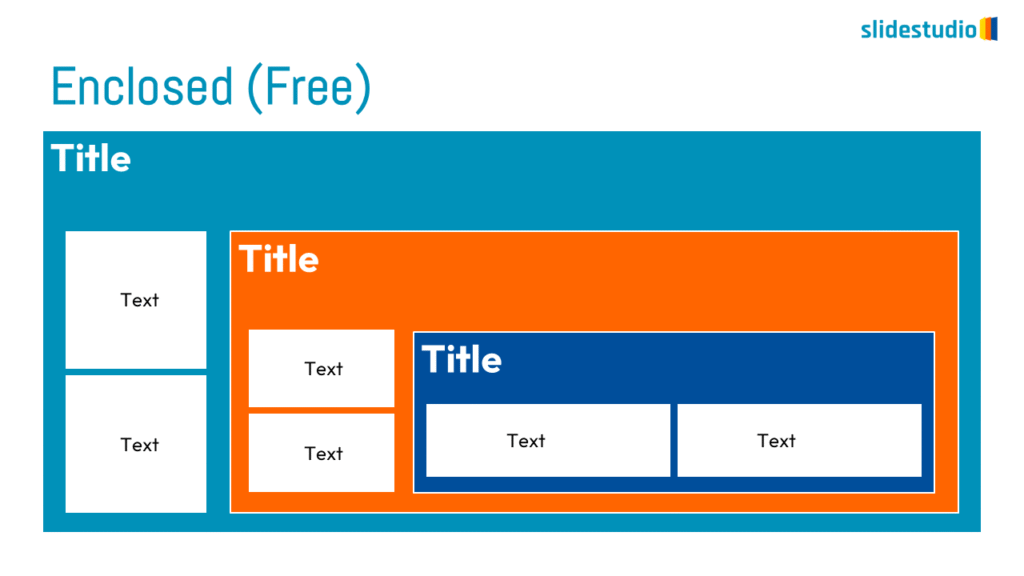
ENCLOSED
Organizes items within borders to highlight containment or separate categories.
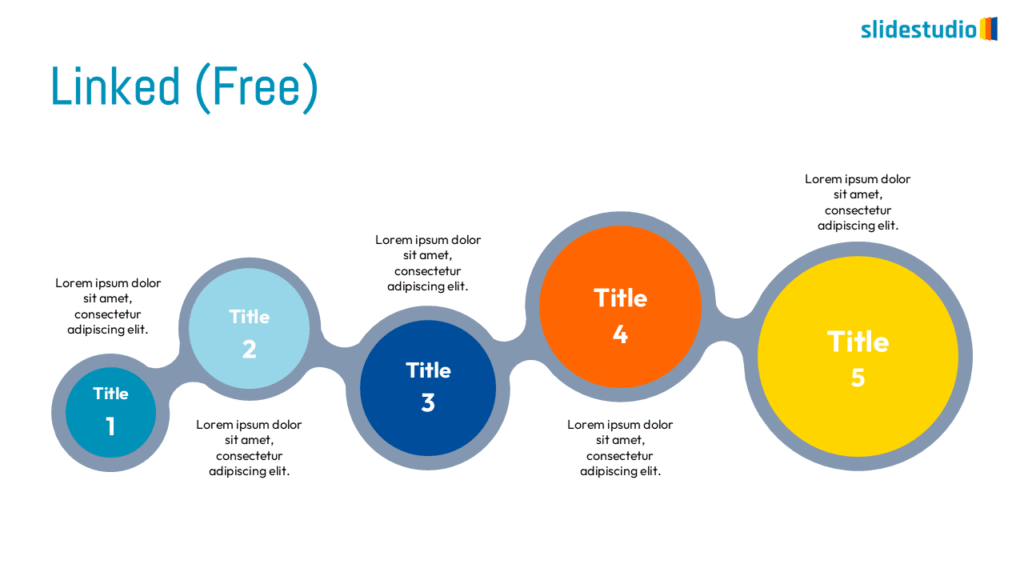
LINKED
Connects elements with lines to illustrate relationships or associations.
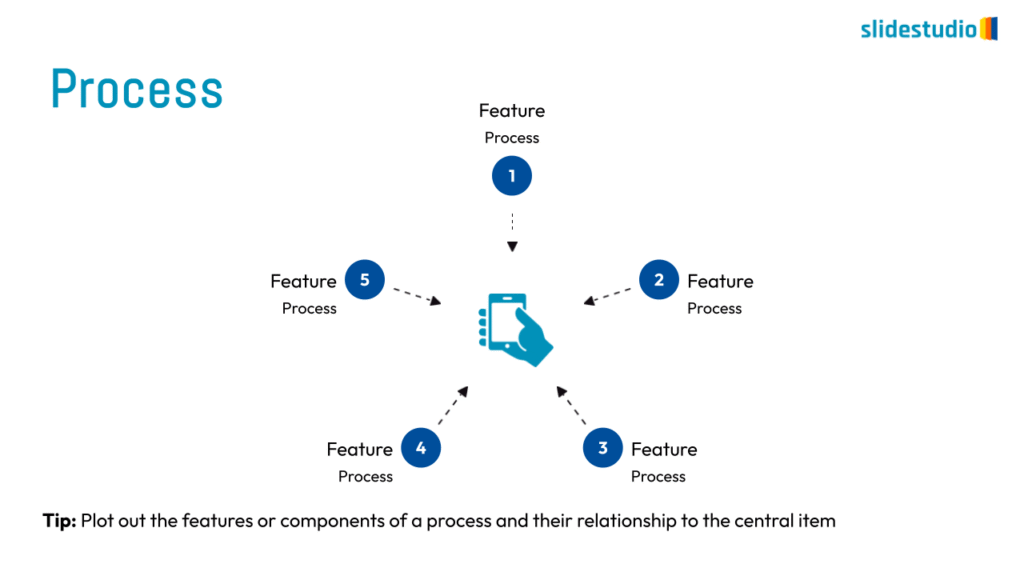
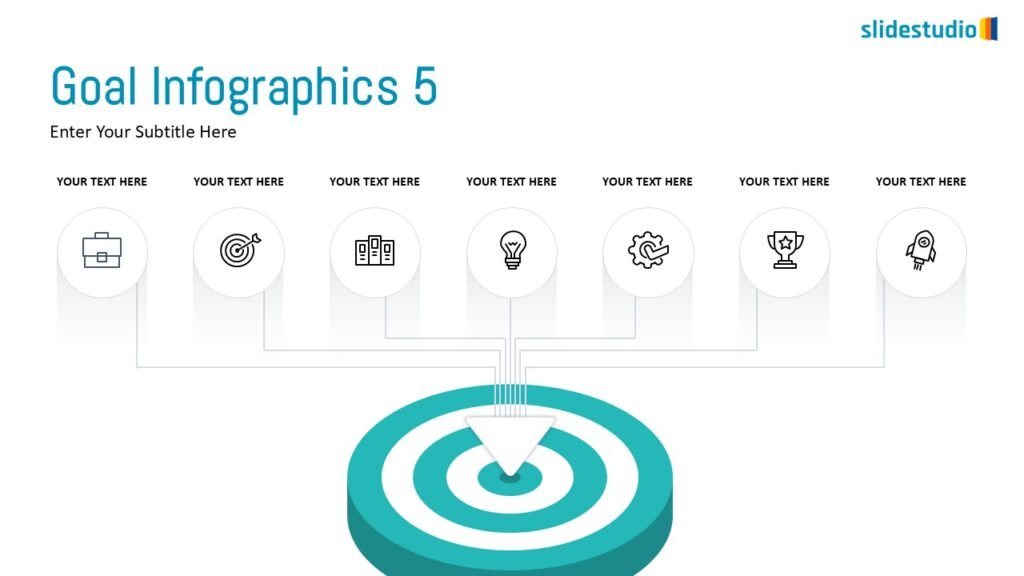
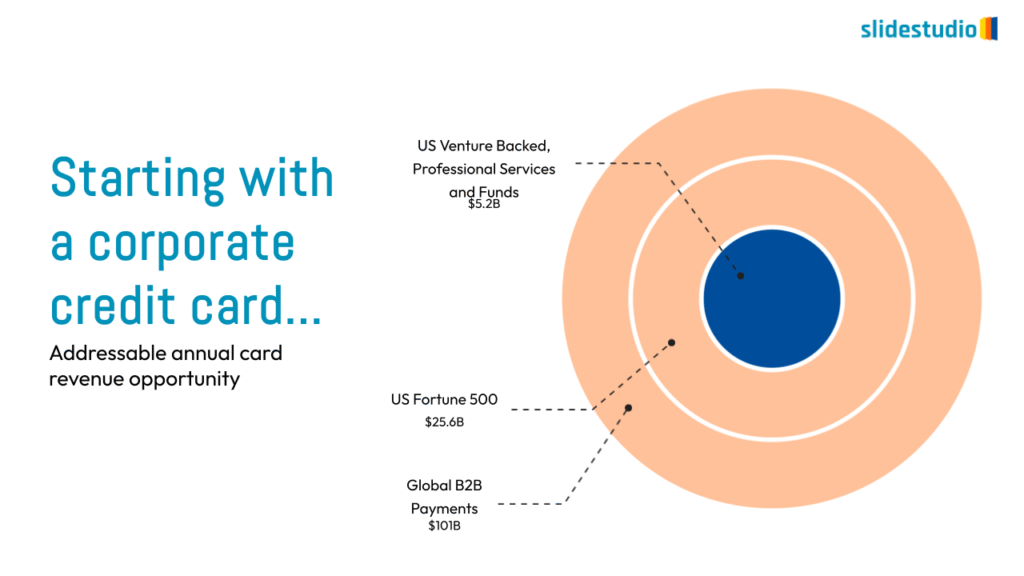
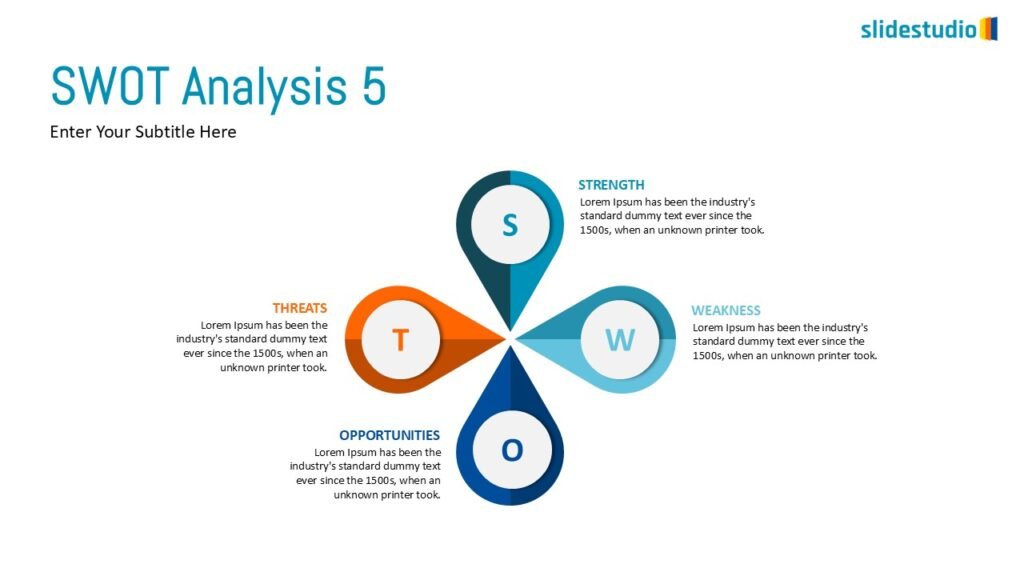
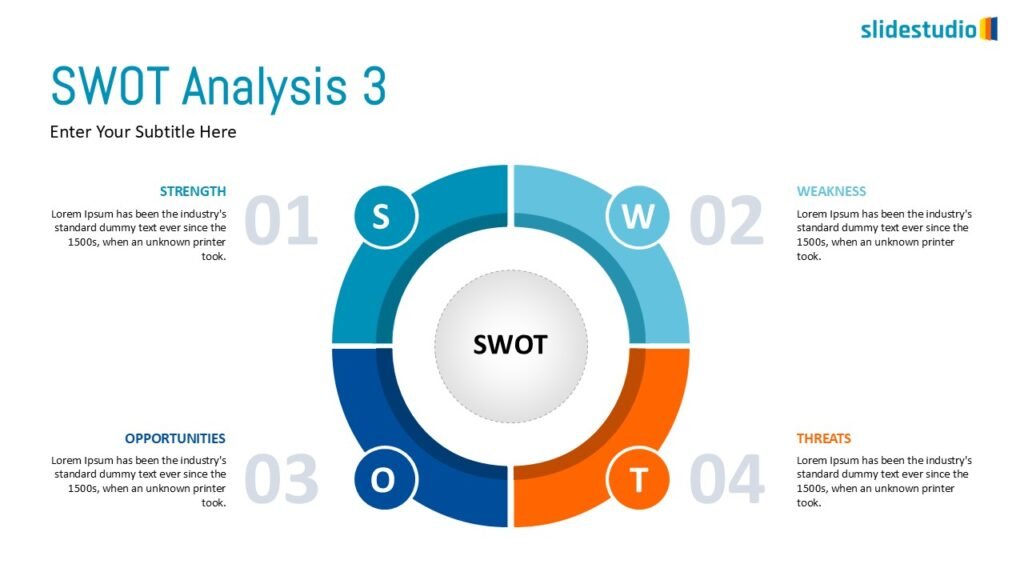
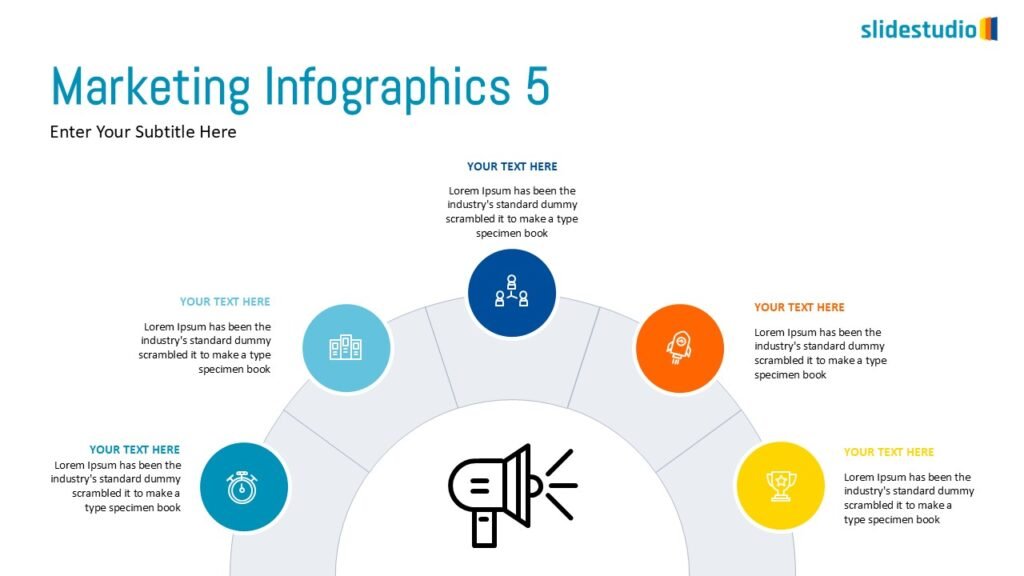
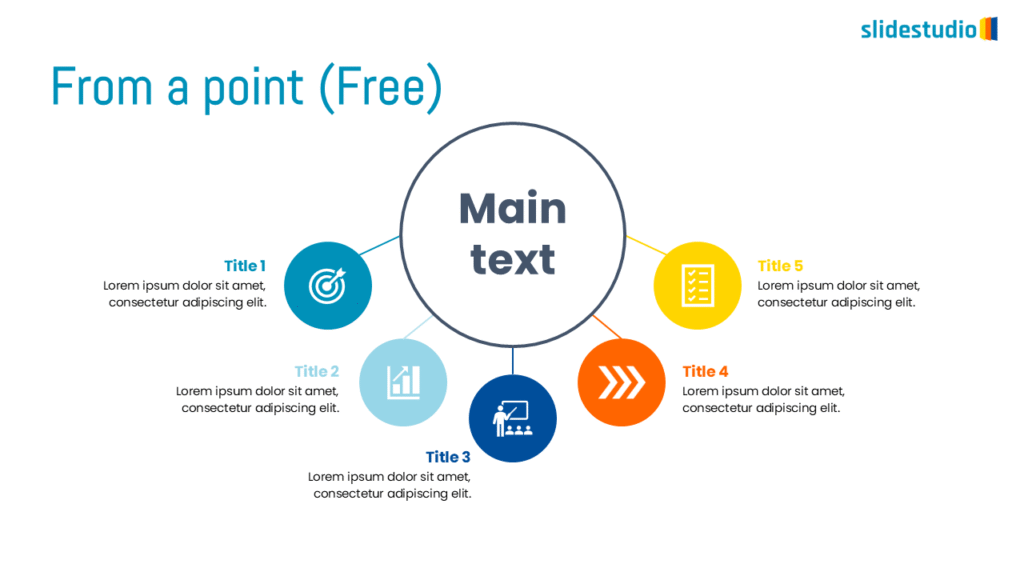
Radiate
This concept shows elements extending outward from a central point, typically illustrating a spread or influence. It can be depicted with or without a core and represents a central idea that radiates outwards.
FROM POINT
Spreads outward from a central point, symbolizing expansion from a core idea.
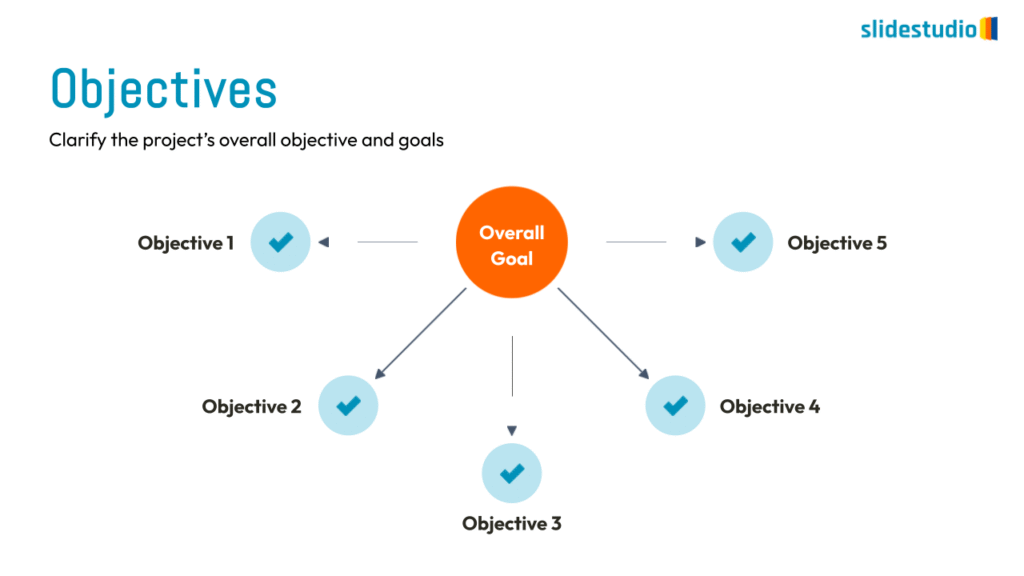
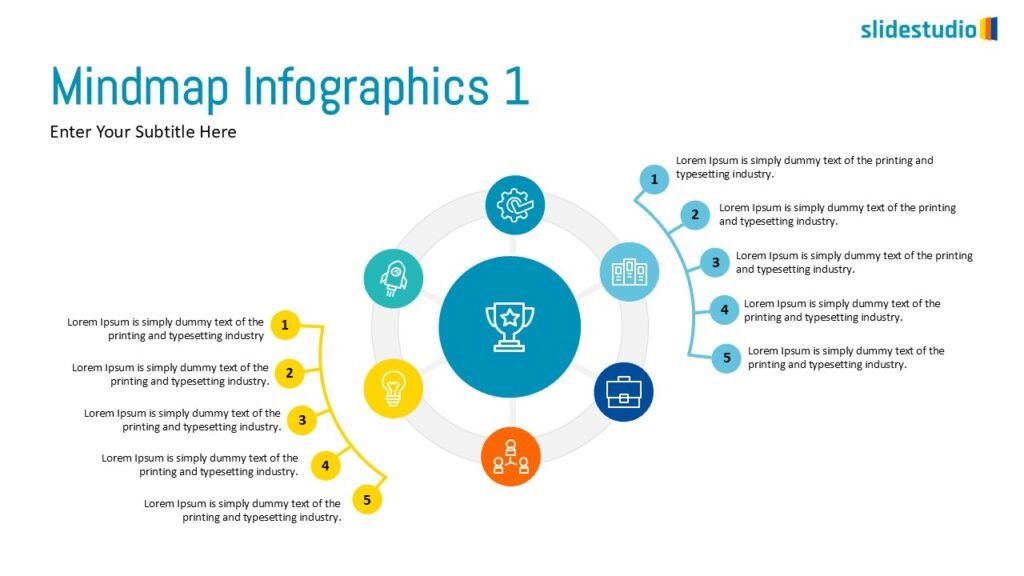
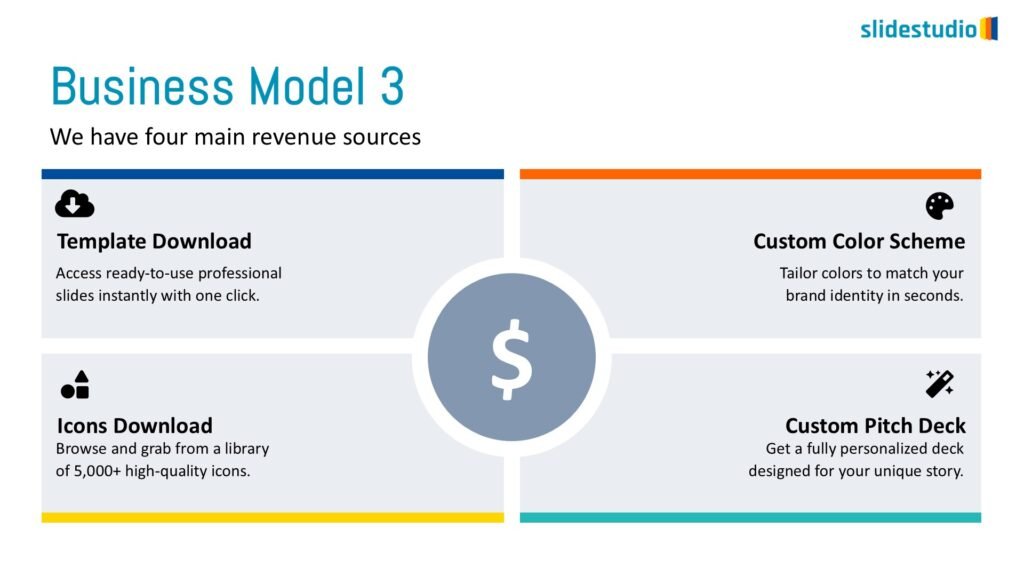
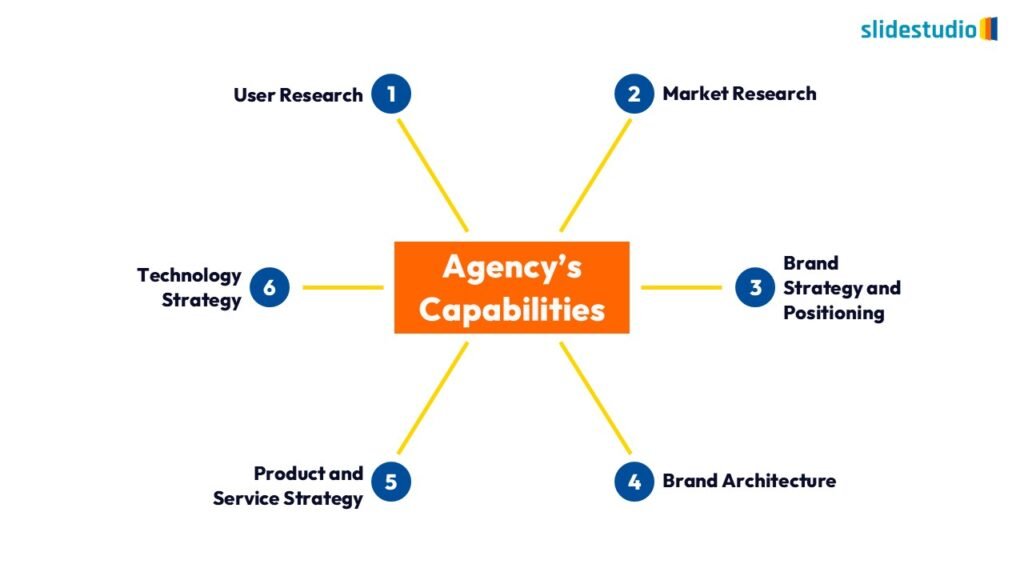
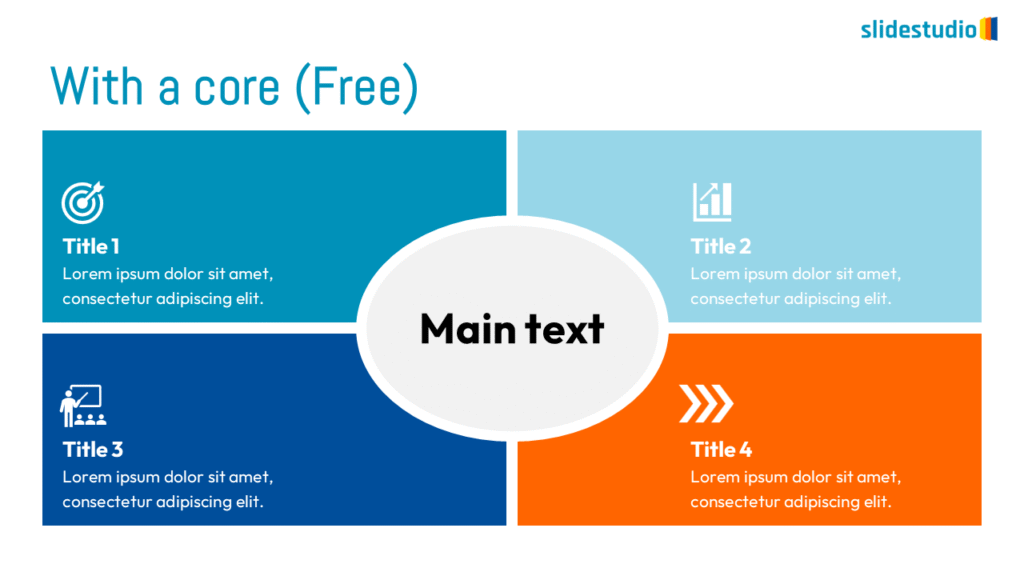
WITH A CORE
Emphasizes a central hub that connects surrounding elements, ideal for mind maps.
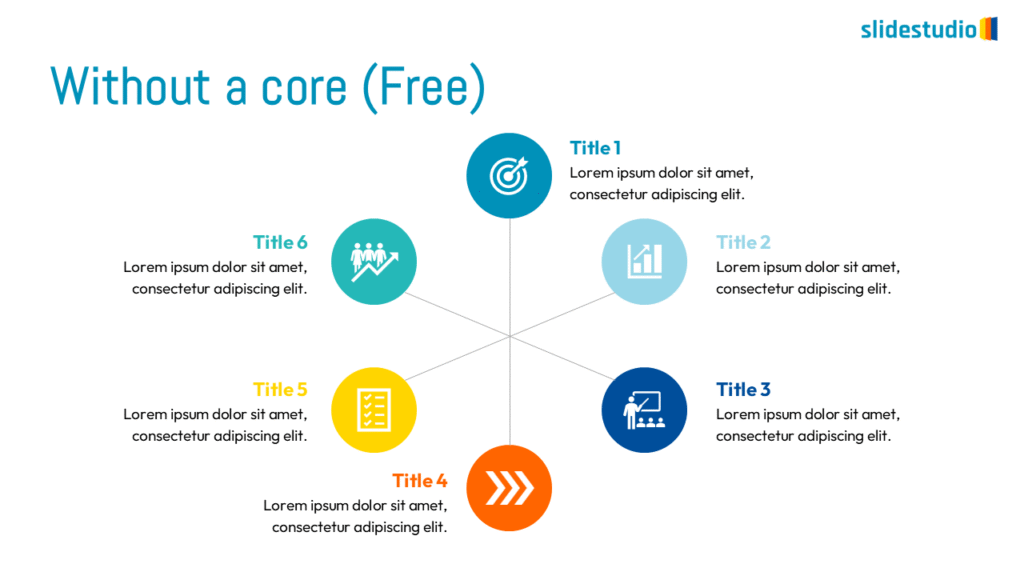
WITHOUT A CORE
Illustrates diffusion or open-ended expansion without a specific focal point.
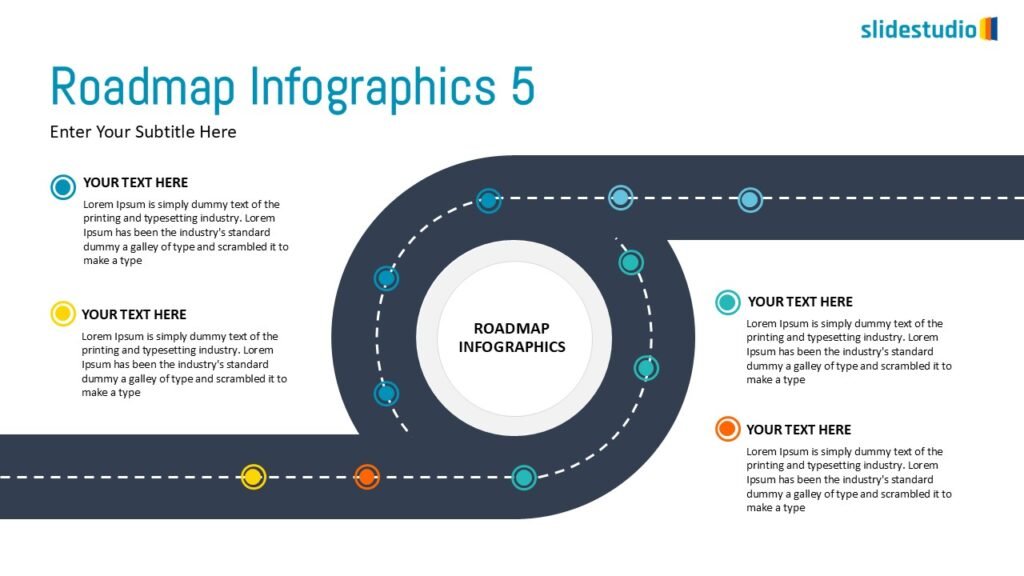
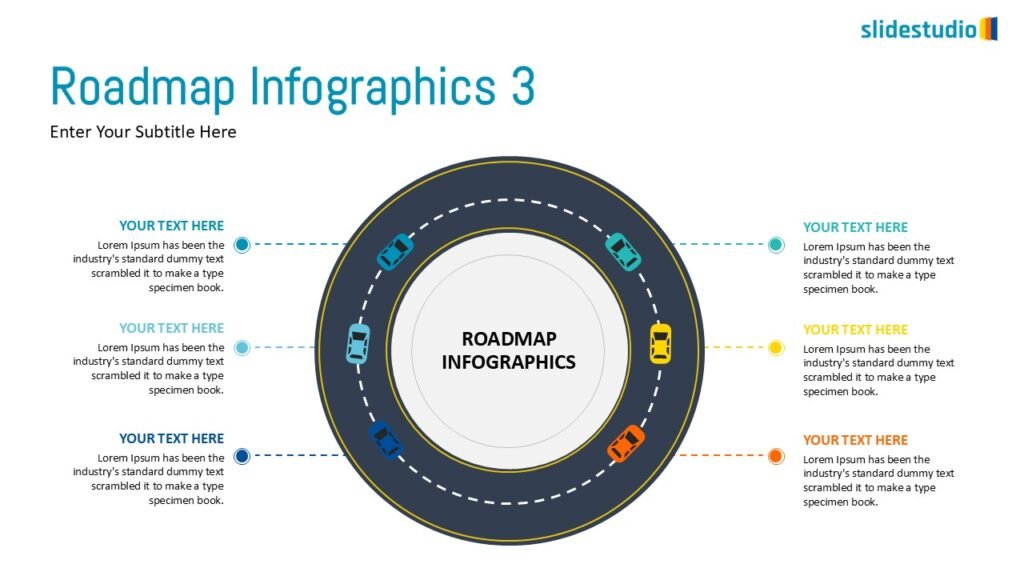
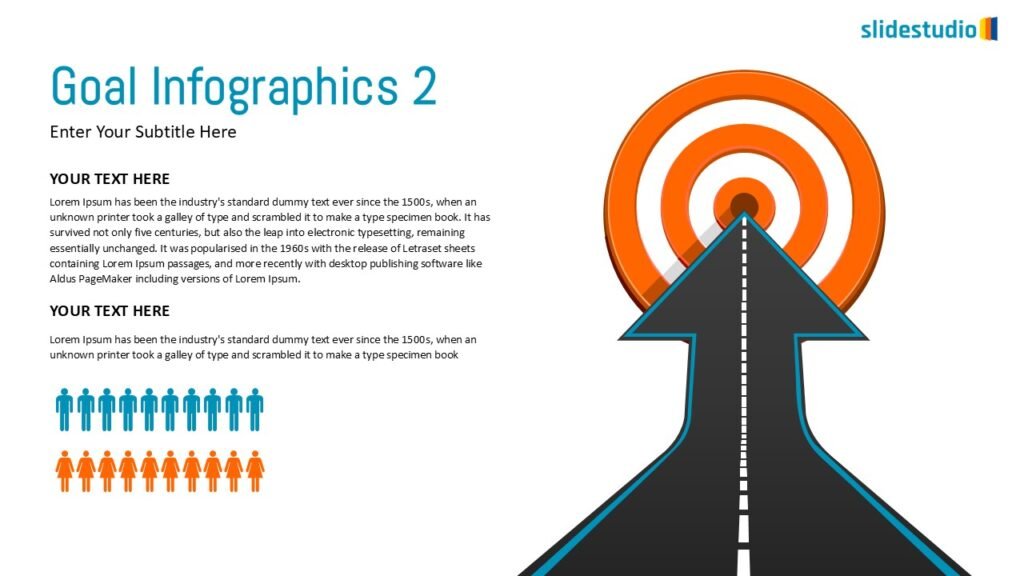
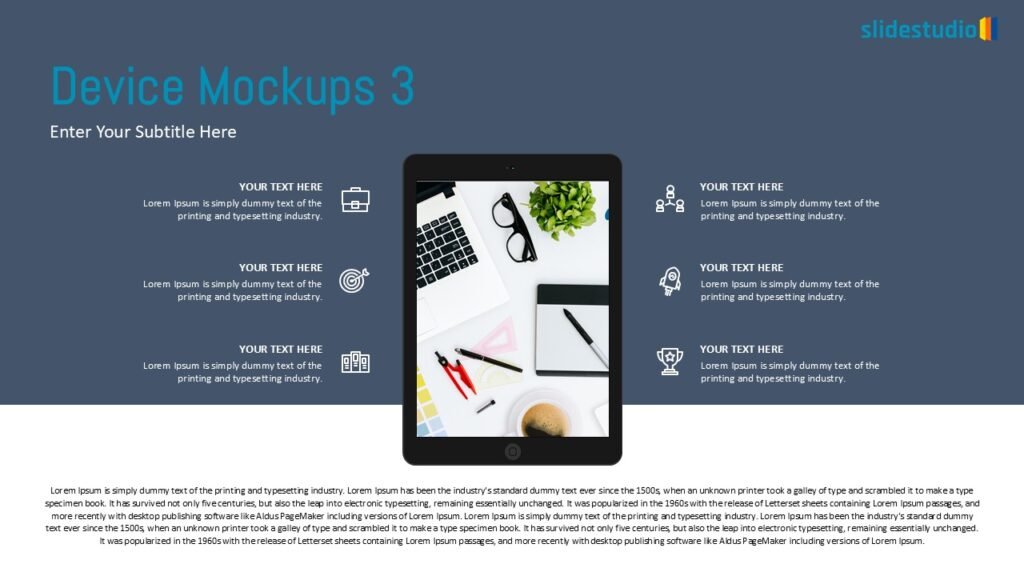
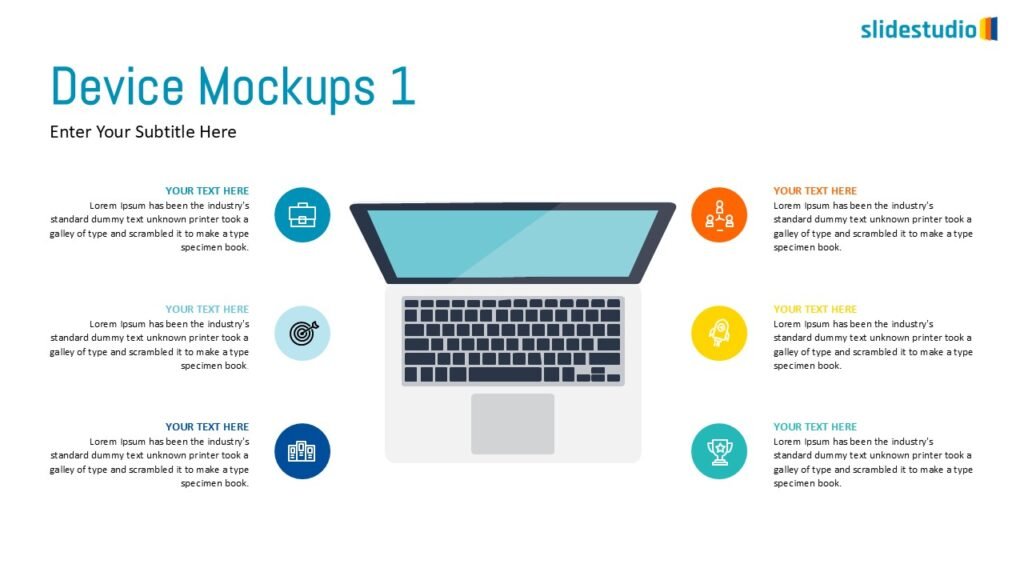
Pictorial
This concept uses images or icons to convey direction, location, reveal processes, or show influence. It provides a visual representation that is easy to understand and adds clarity to directional or procedural content.
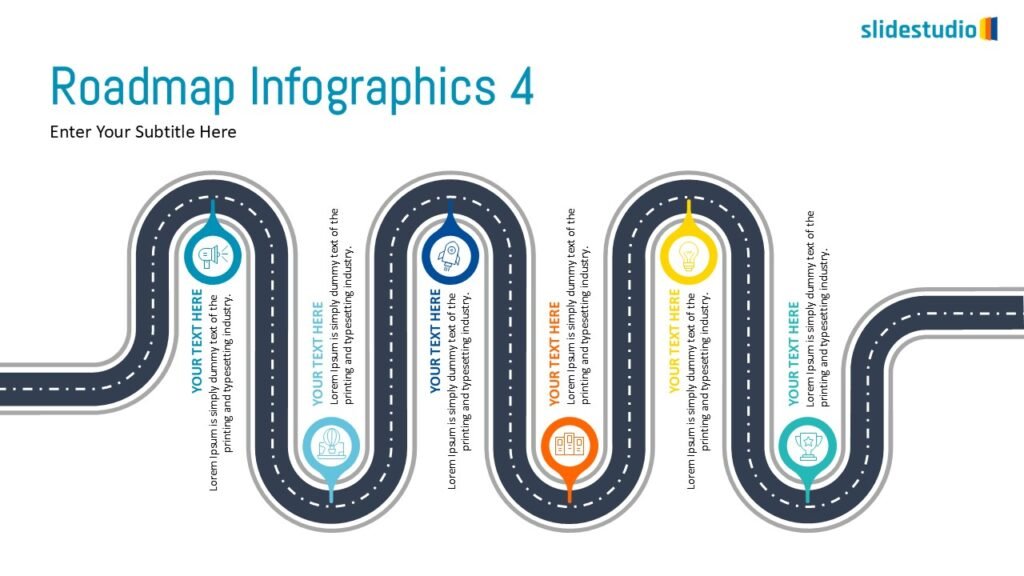
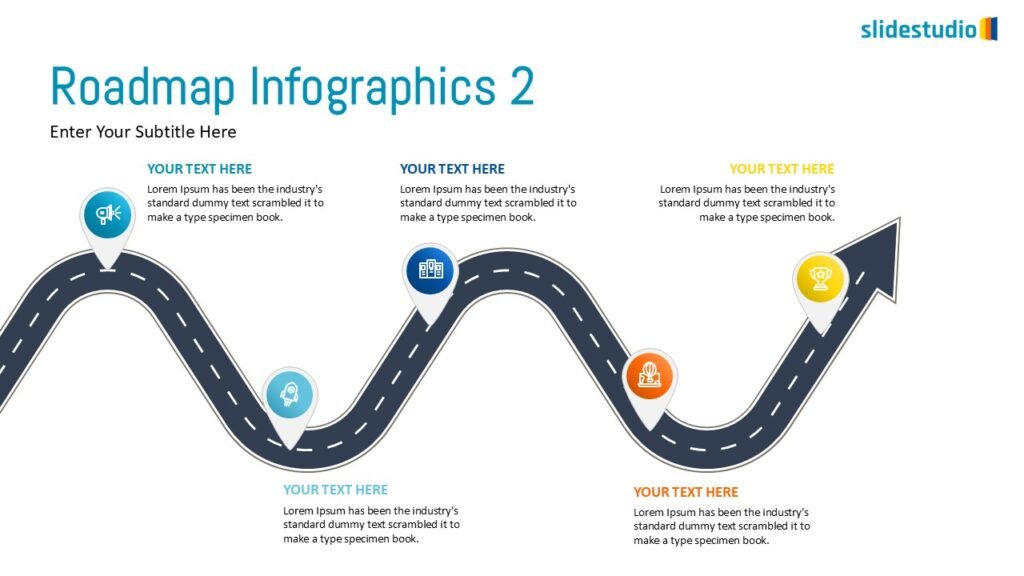
DIRECTION
Uses arrows or paths to guide viewers through a specific route or sequence.
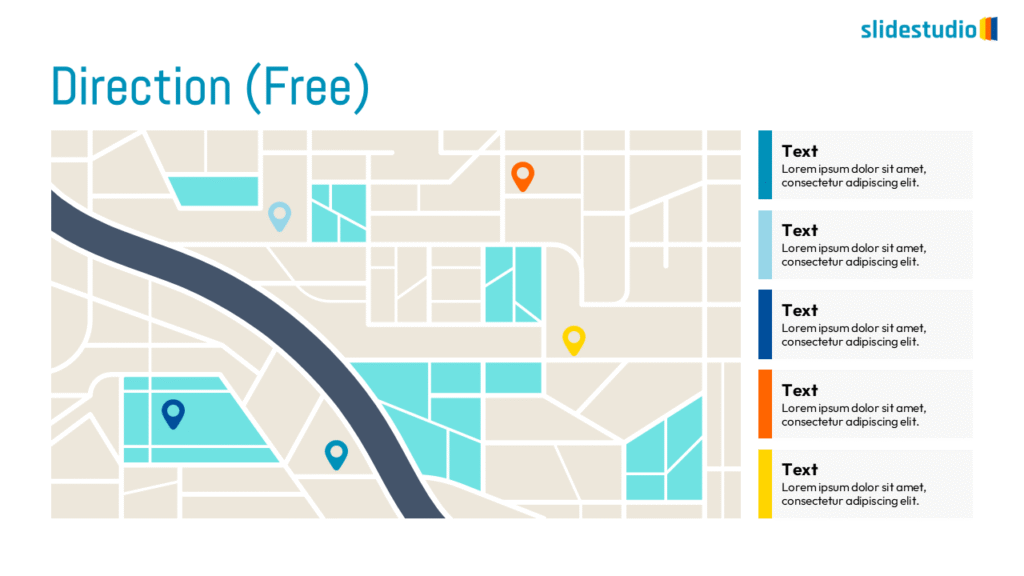
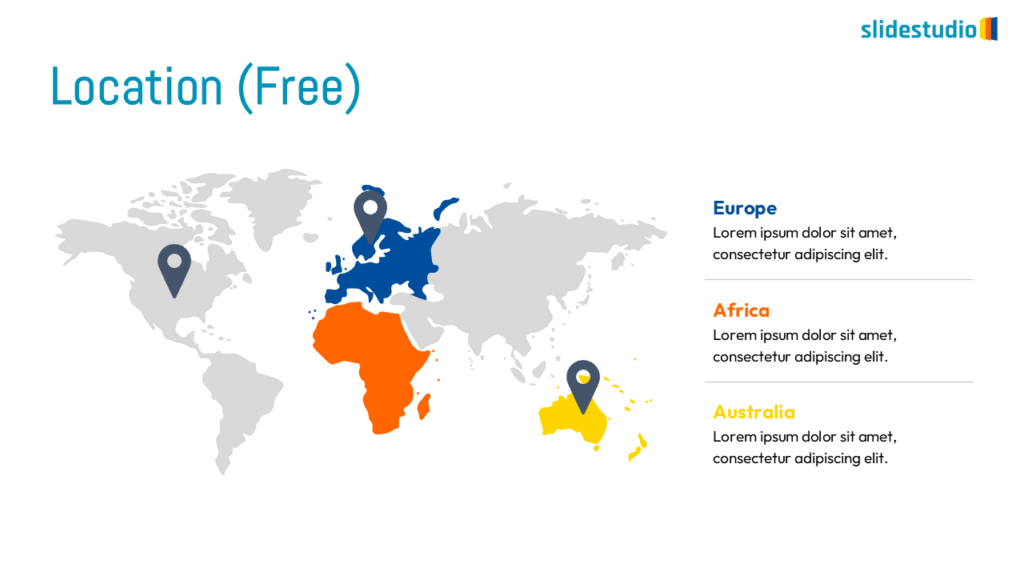
LOCATION
Pinpoints positions within a layout, helpful for mapping or highlighting key areas.
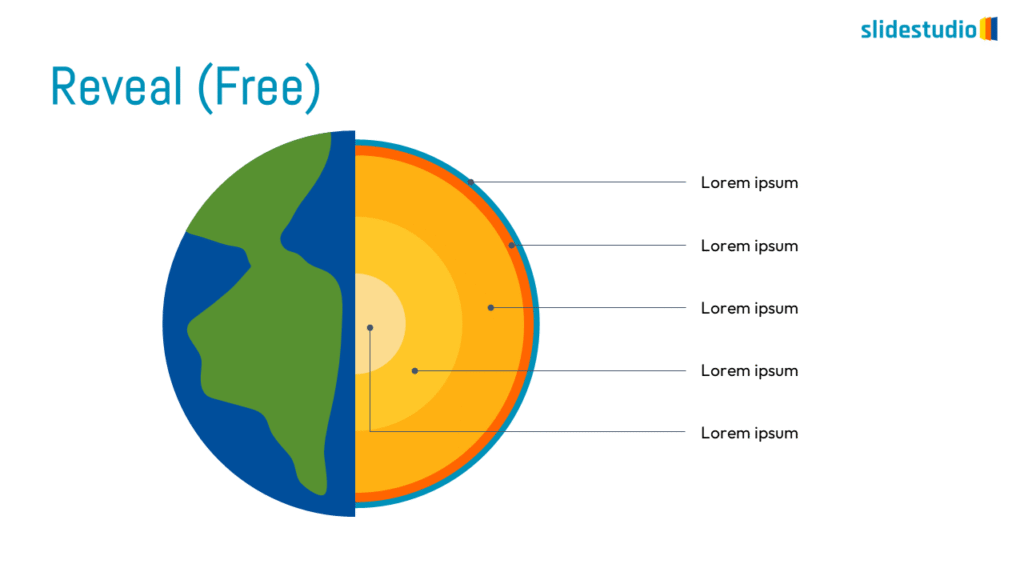
REVEAL
Gradually uncovers information step-by-step, ideal for phased presentations.
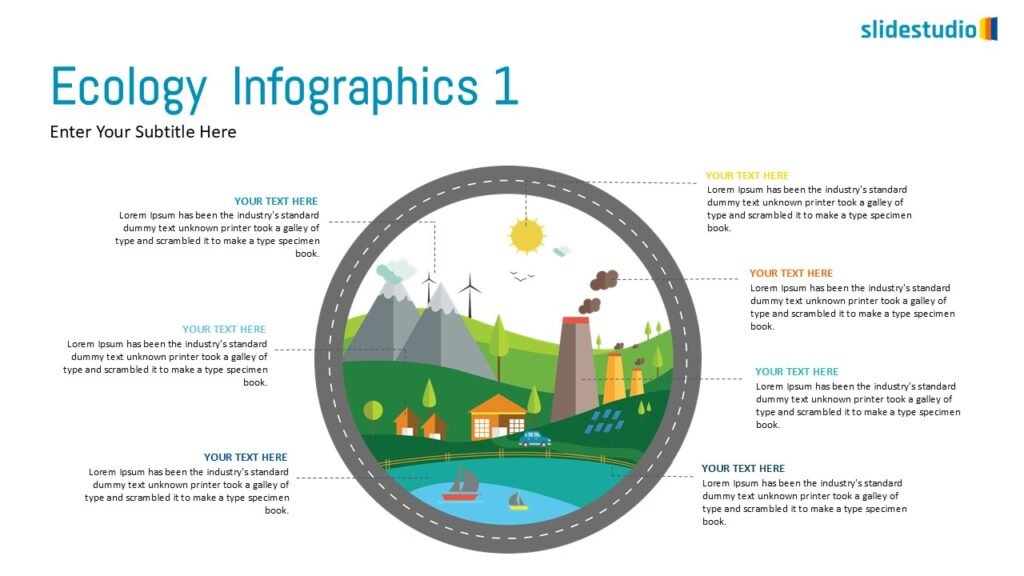
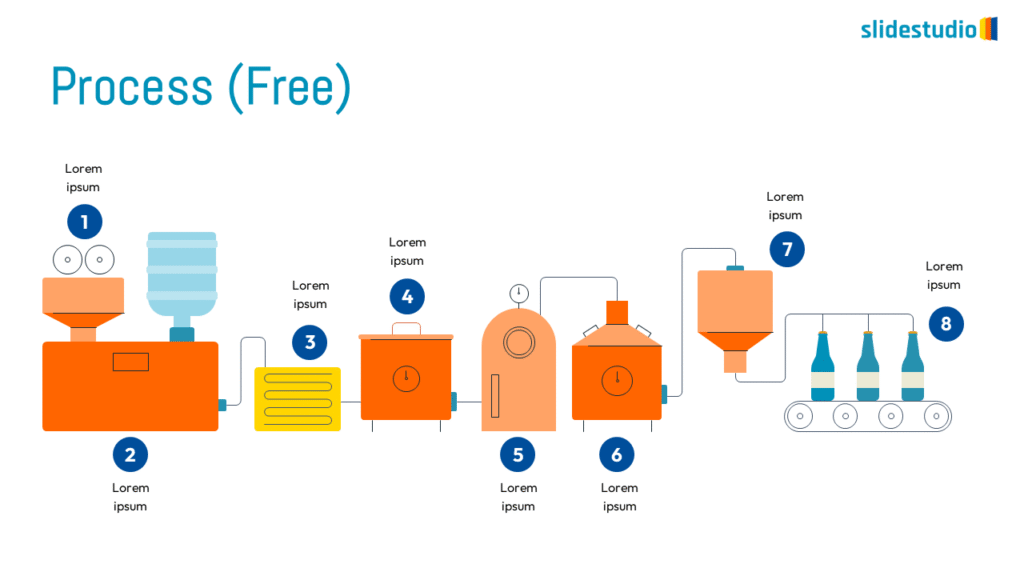
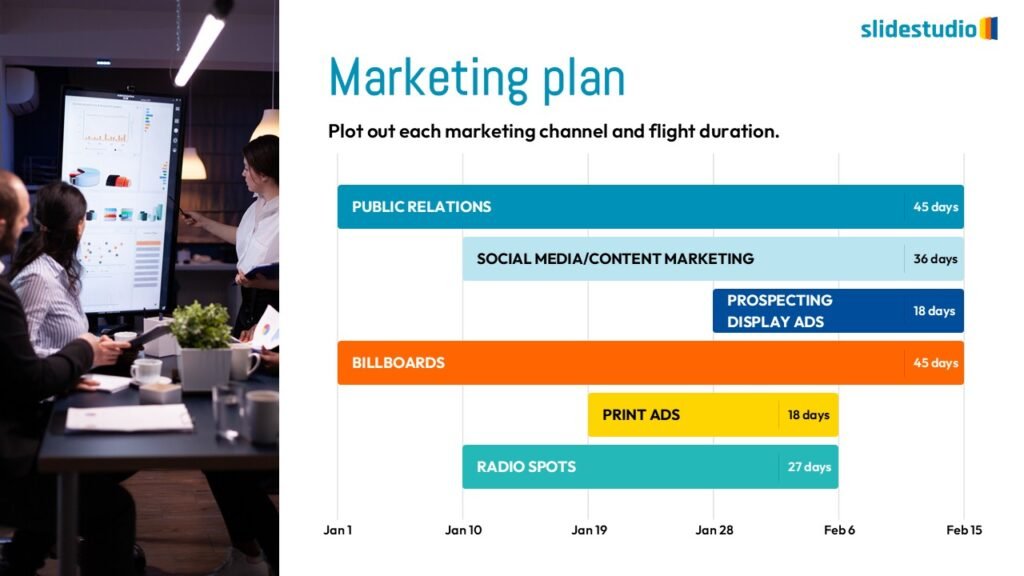
PROCESS
Shows stages within a workflow to visualize a continuous sequence of tasks.
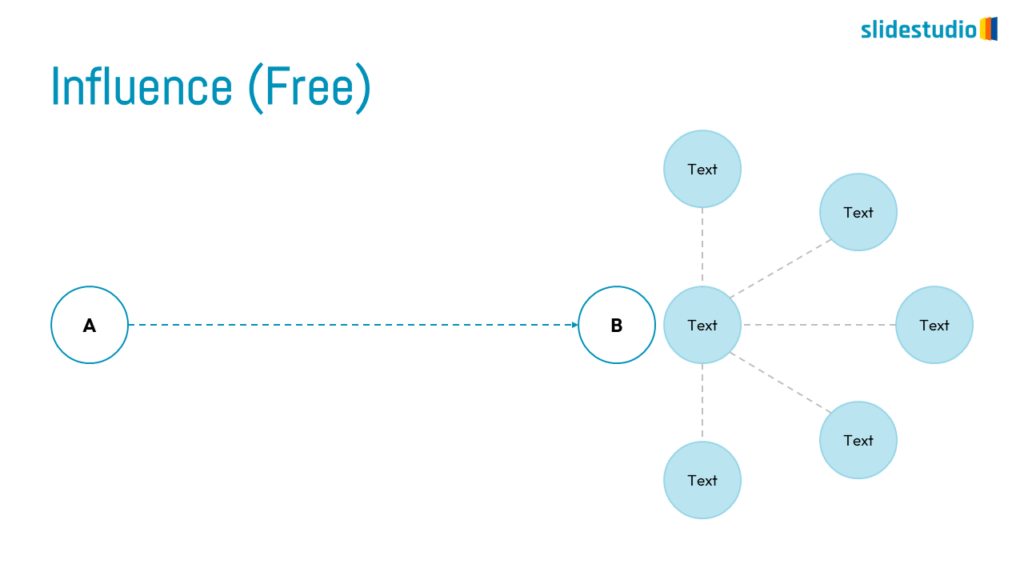
INFLUENCE
Maps the impact of a central idea by showing its connections and reach.
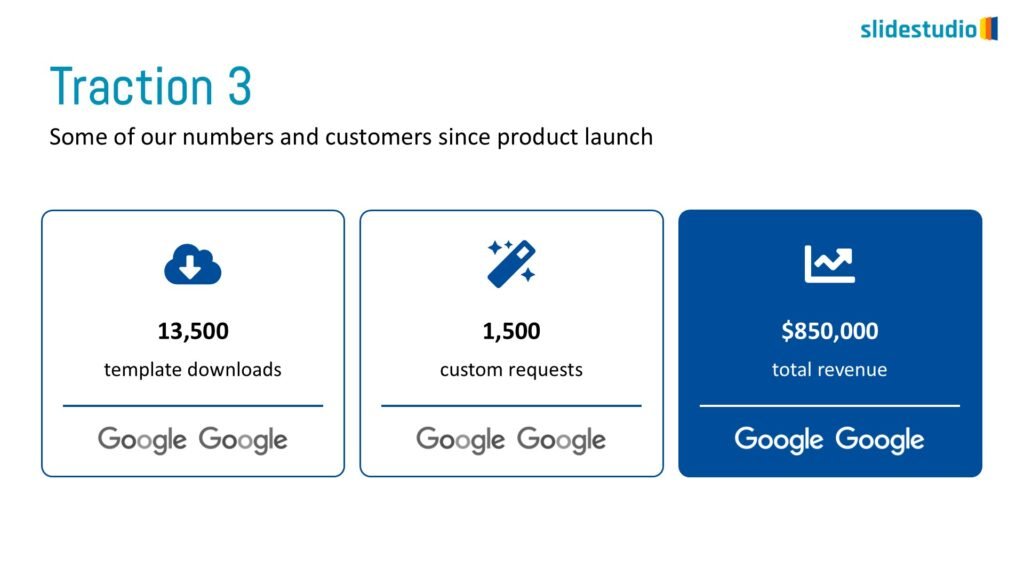
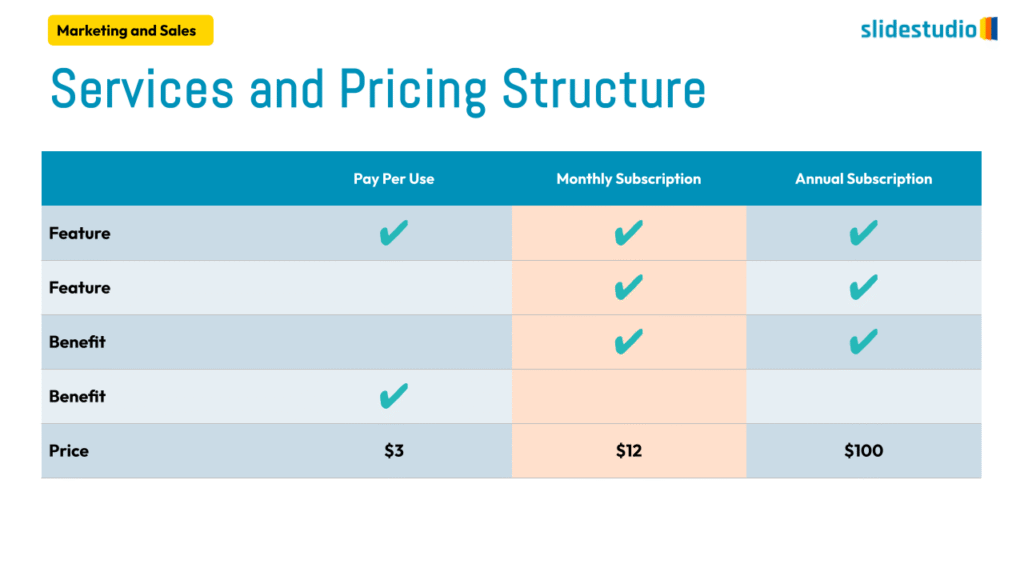
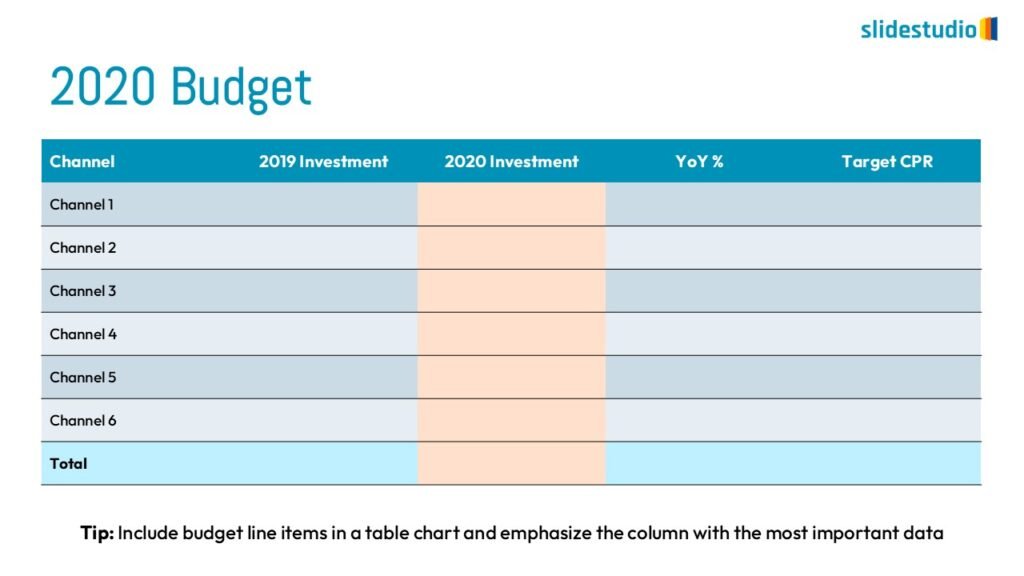
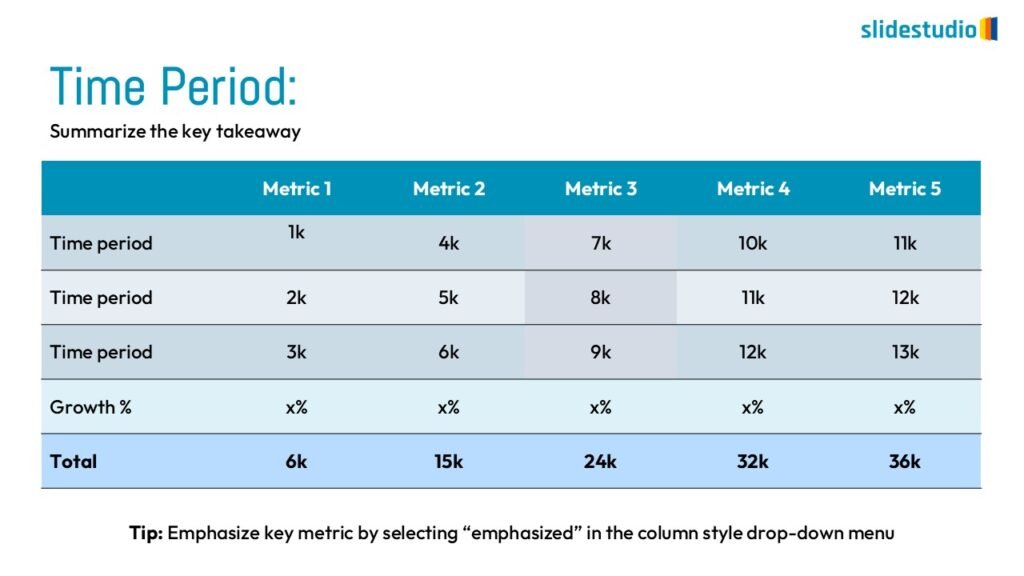
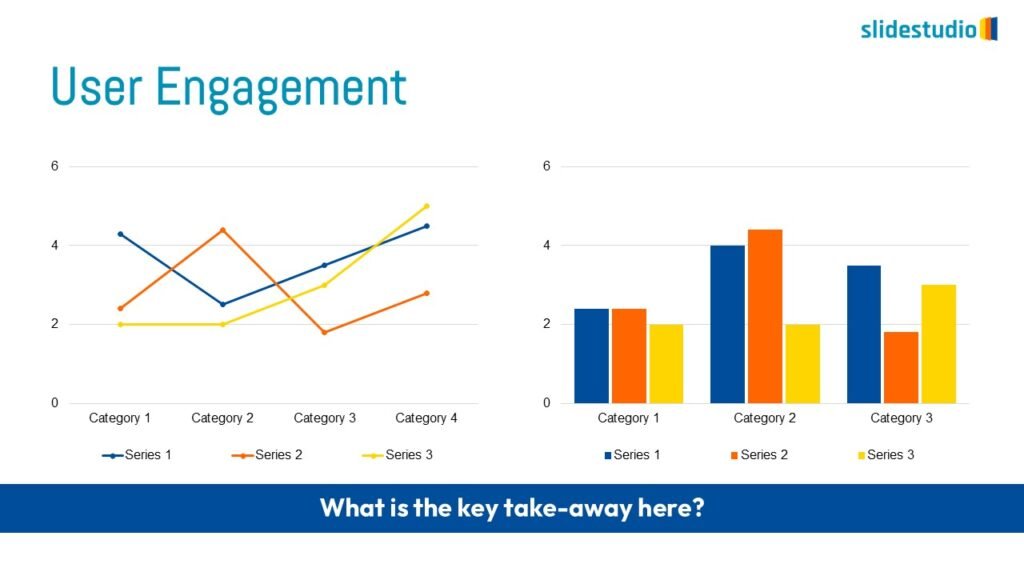
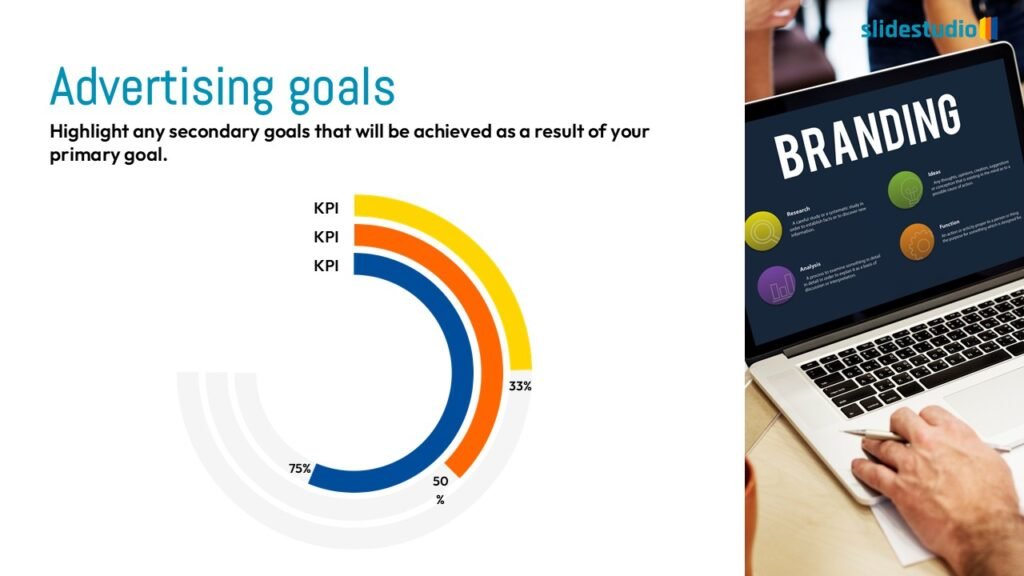
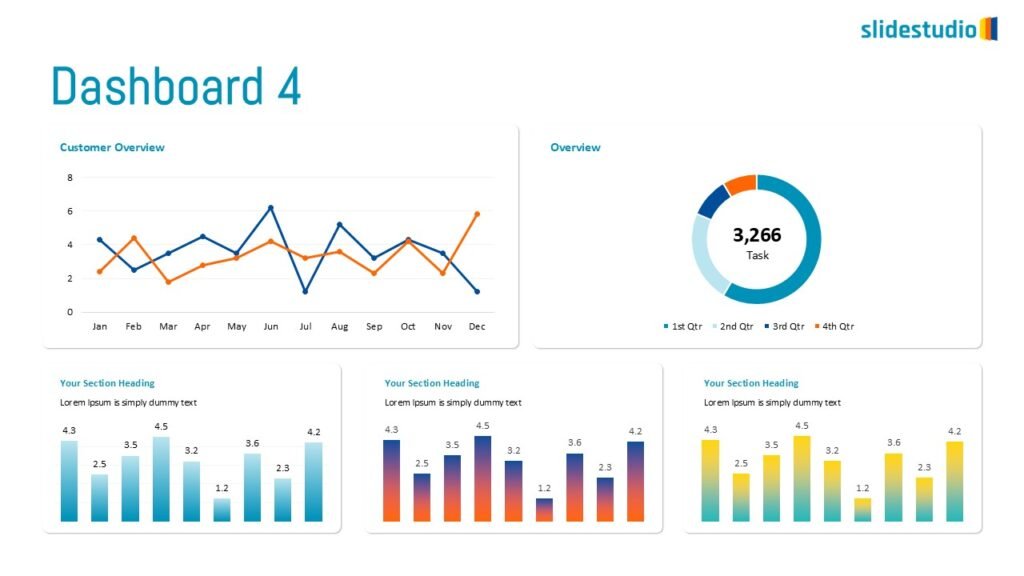
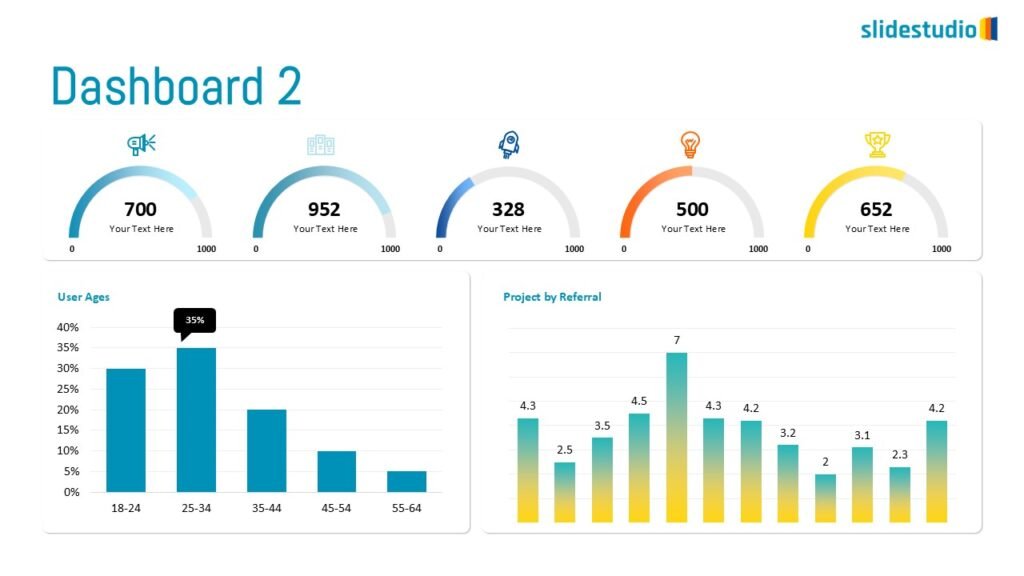
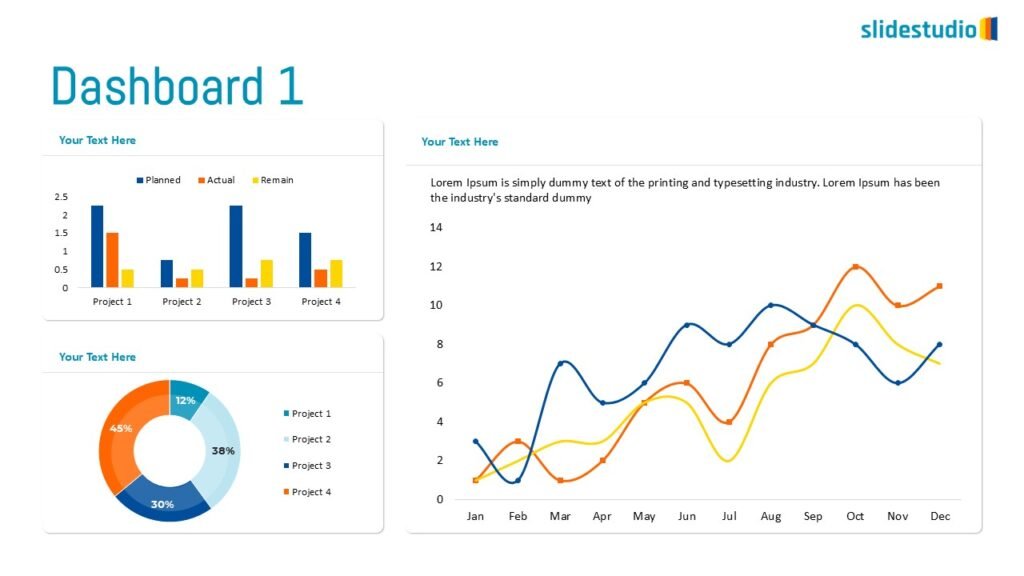
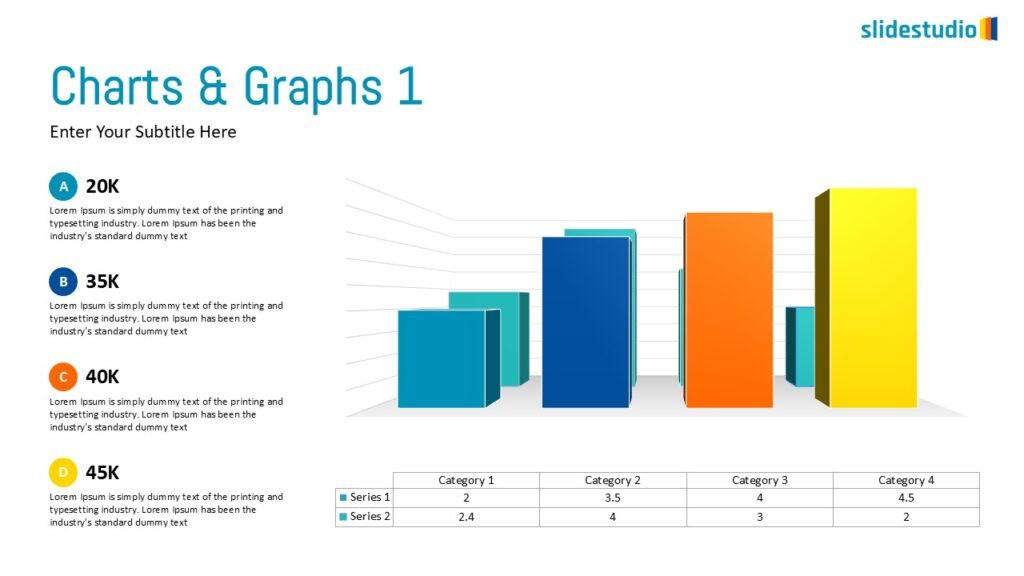
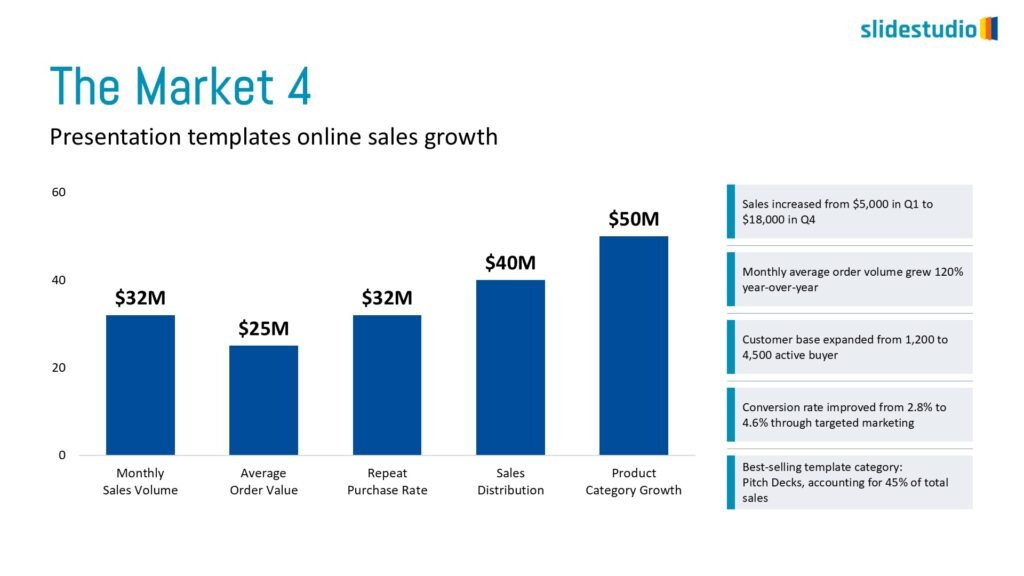
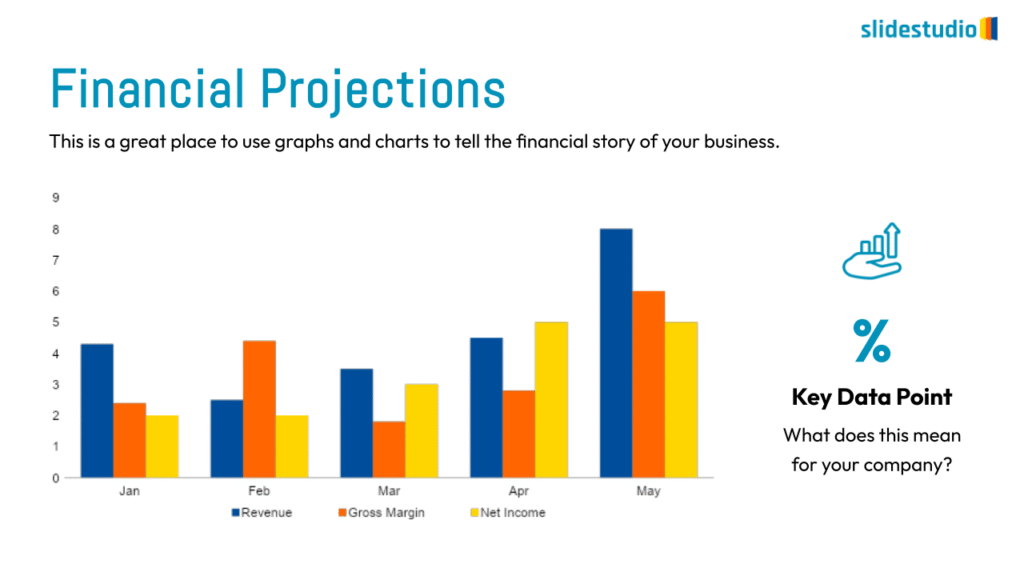
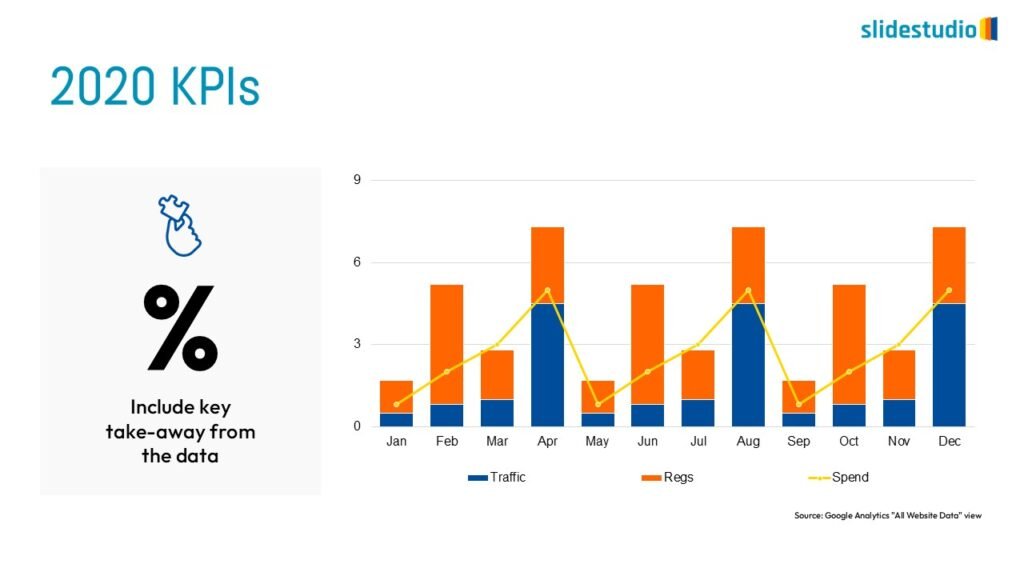
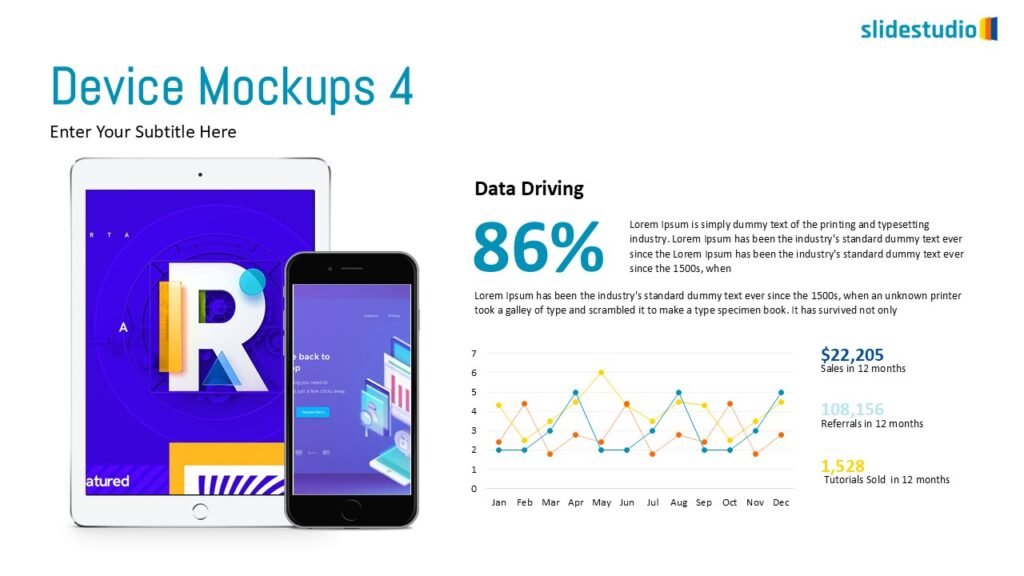
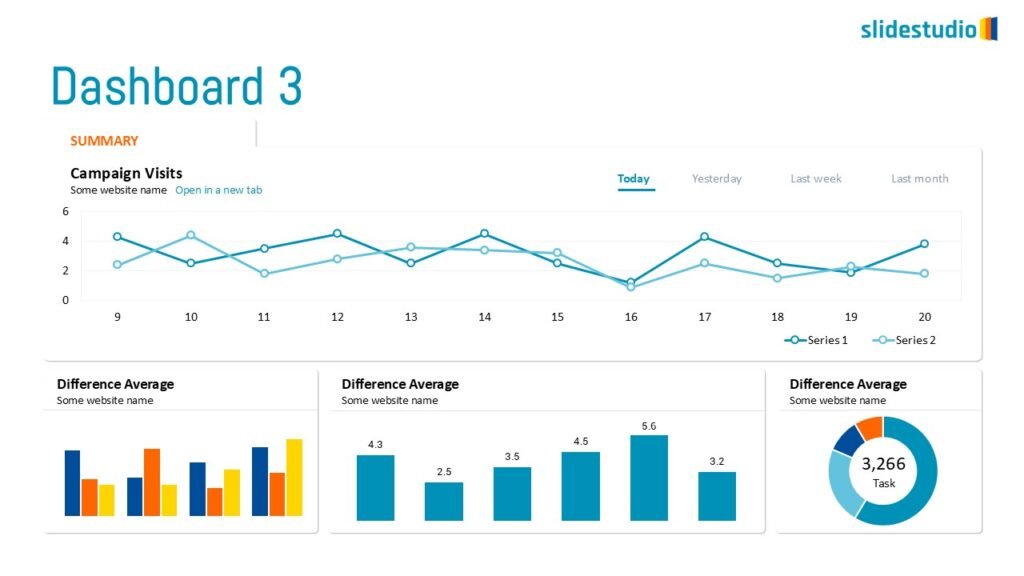
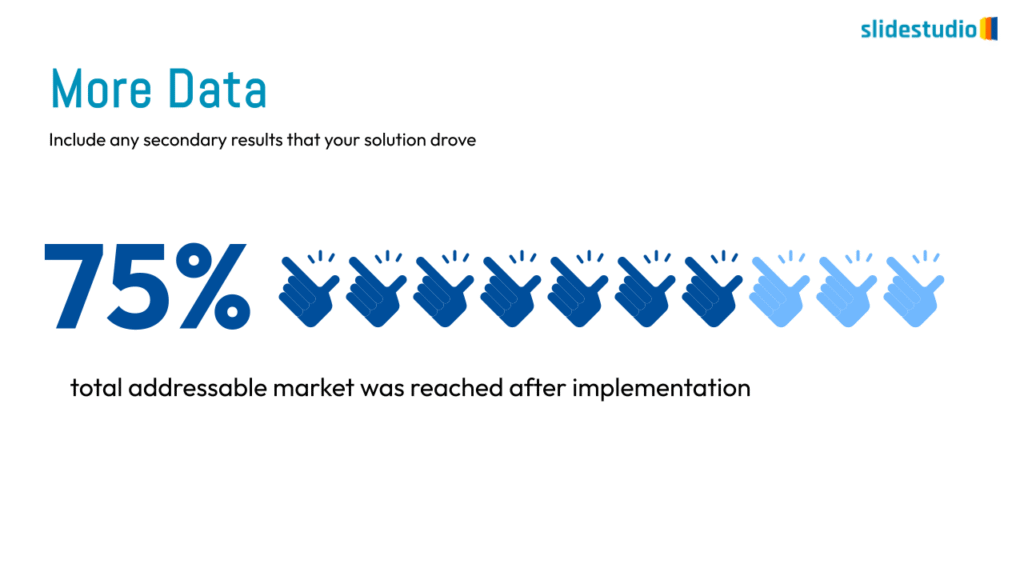
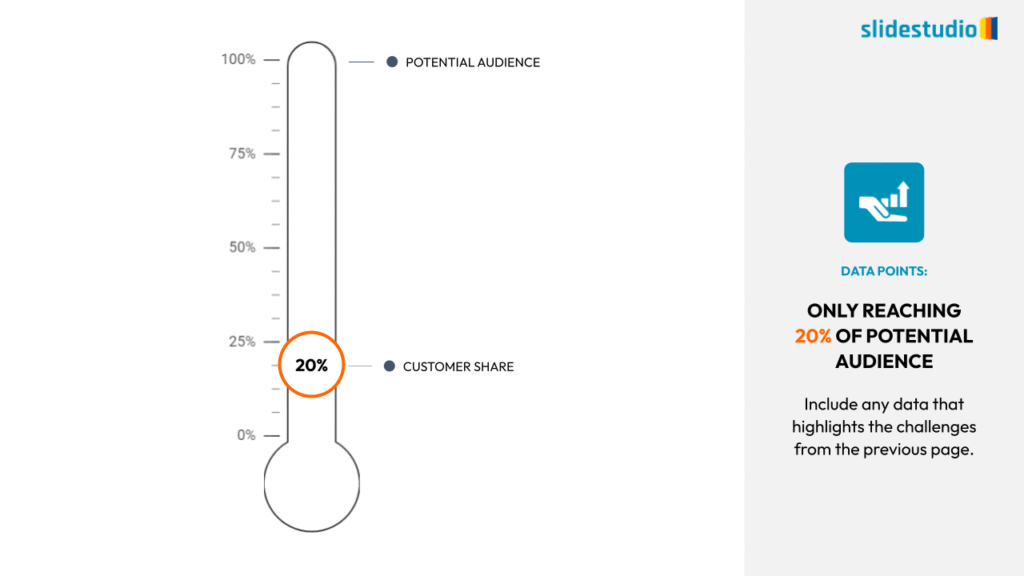
Display Data
This concept focuses on presenting data in a visual format, such as comparisons, trends, or distributions. Common methods include charts, graphs, or other data visualization techniques to make information easier to interpret at a glance.
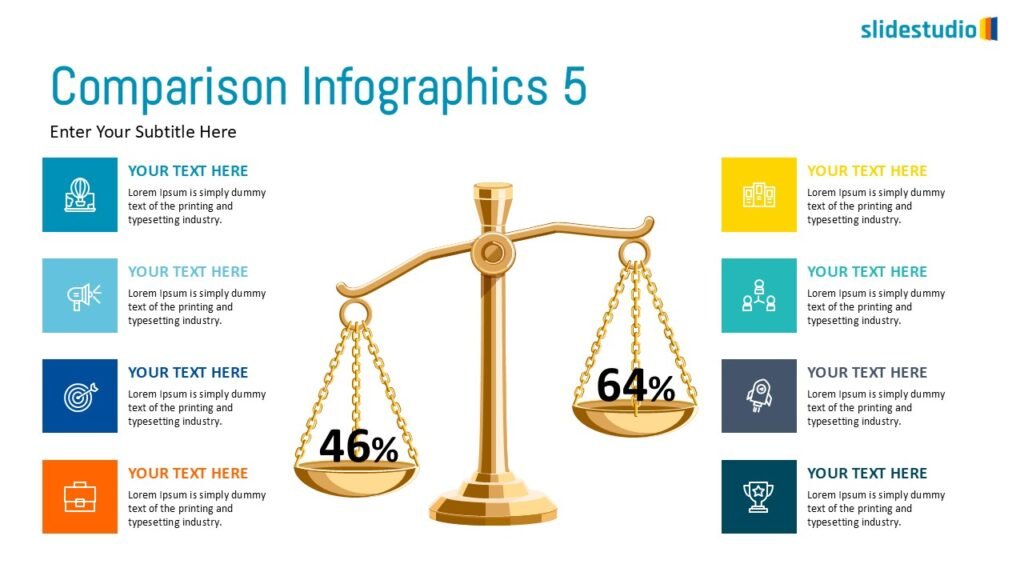
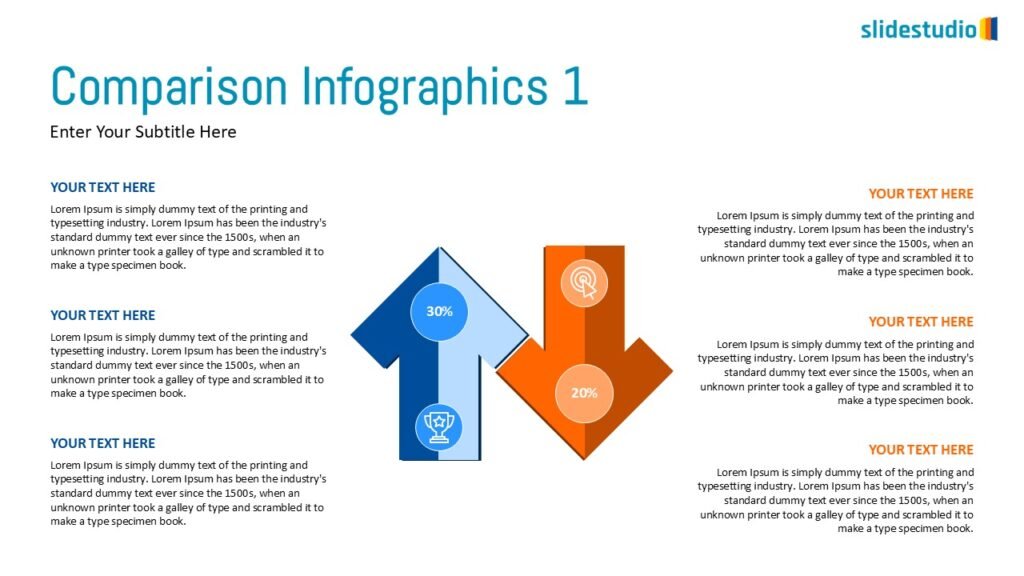
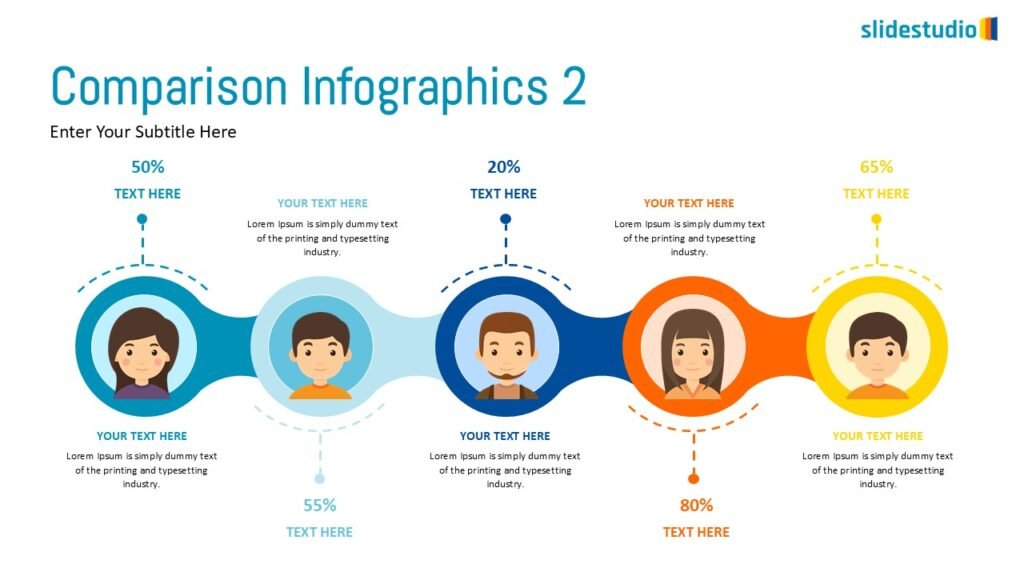
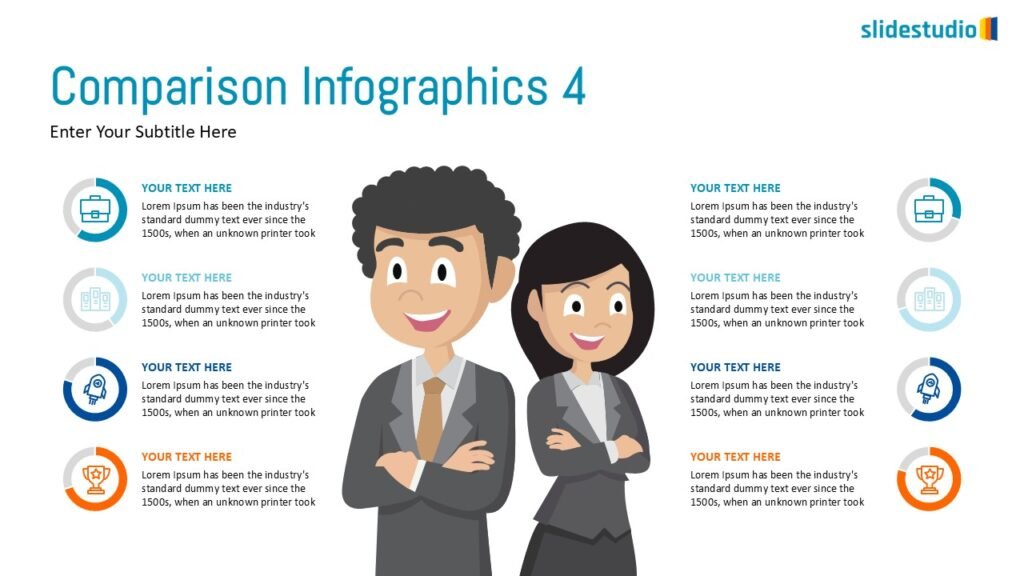
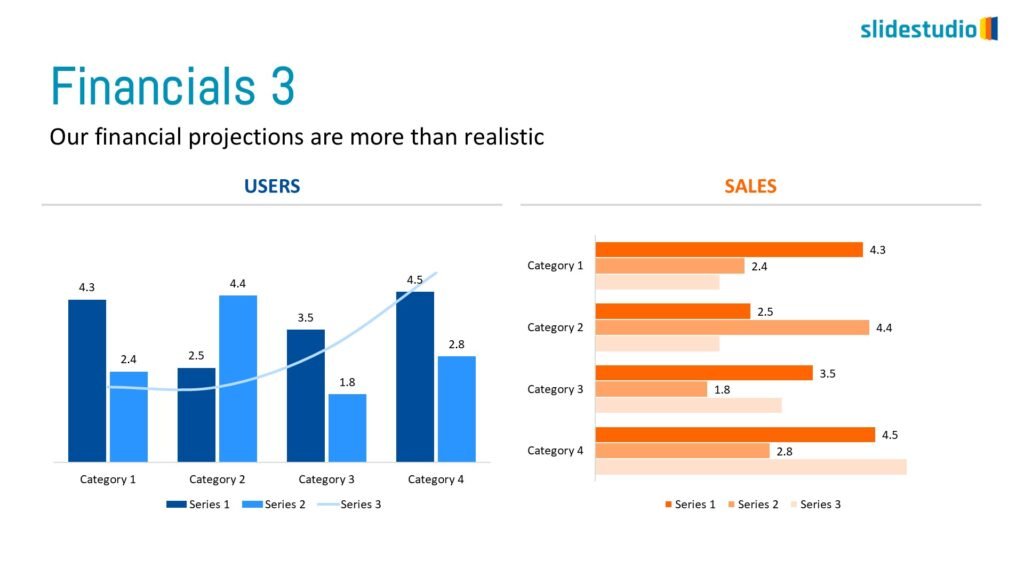
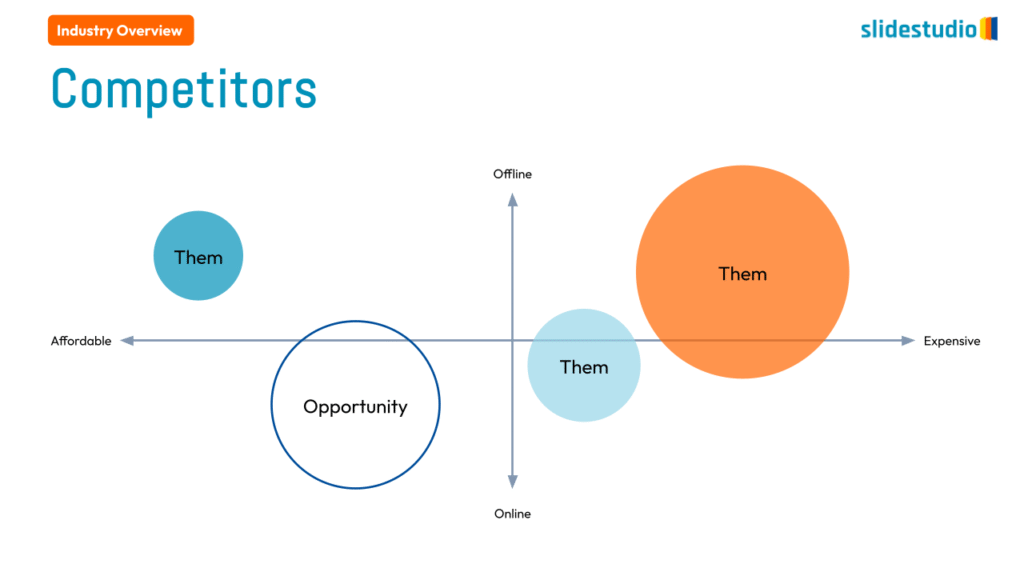
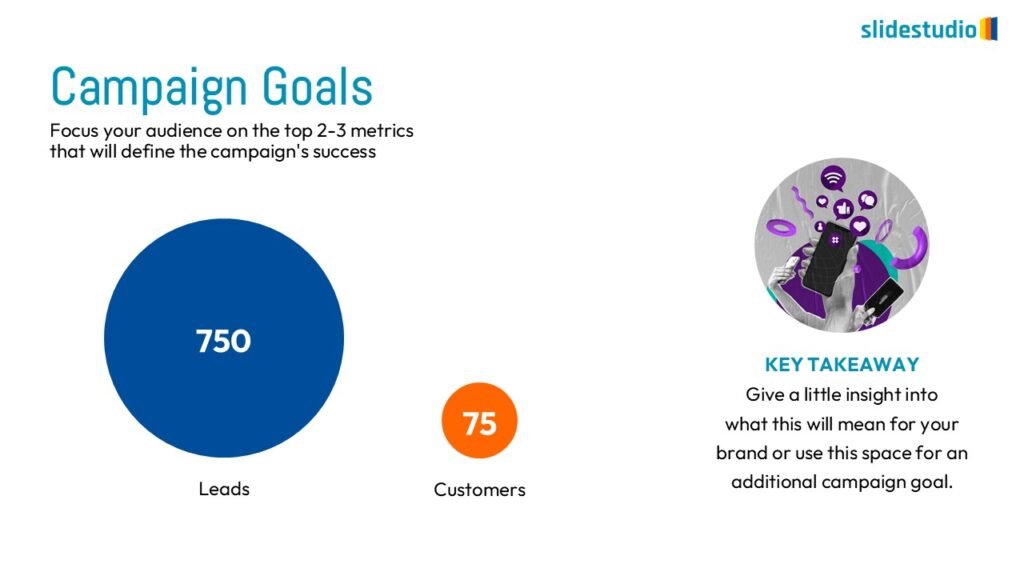
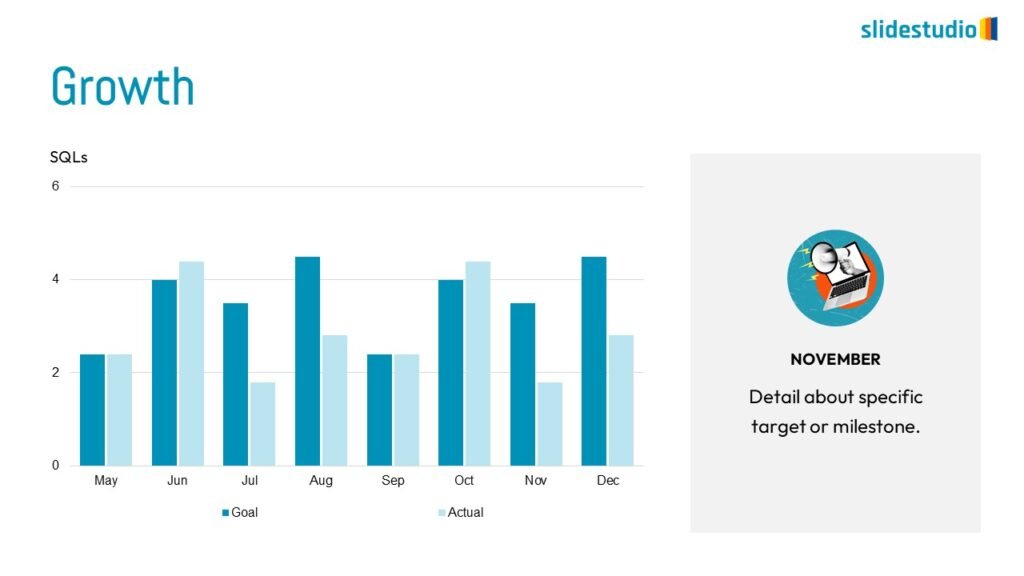
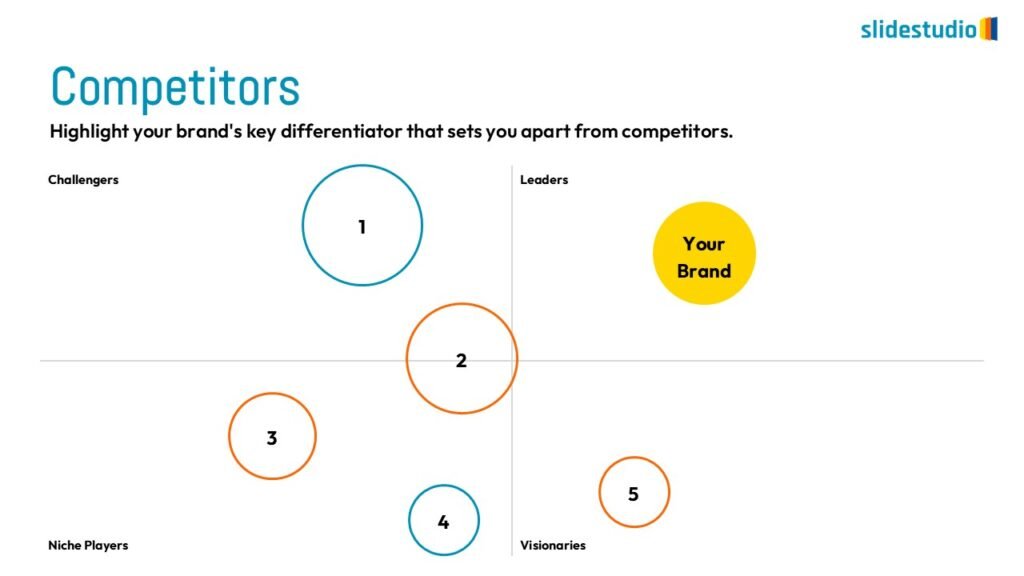
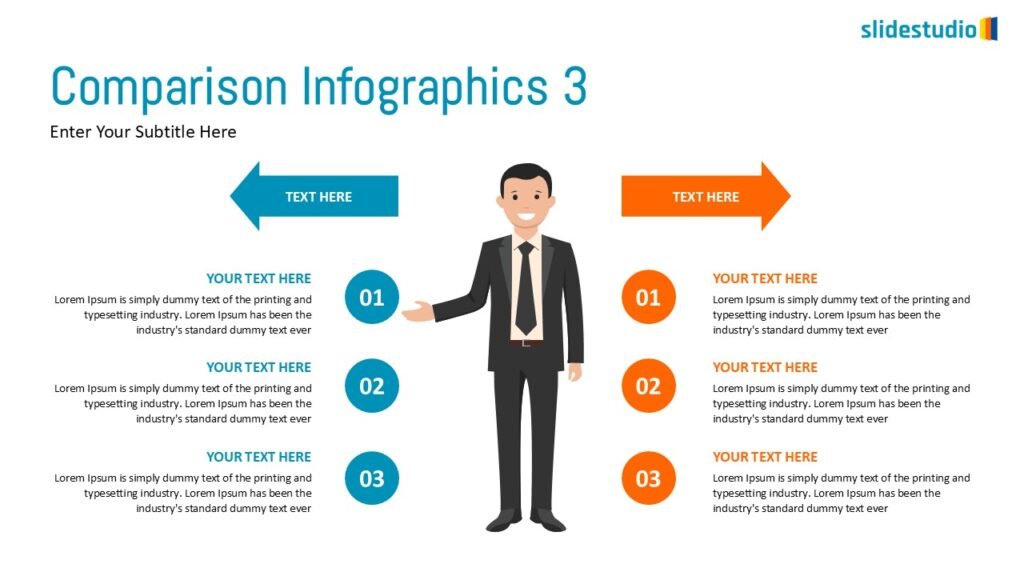
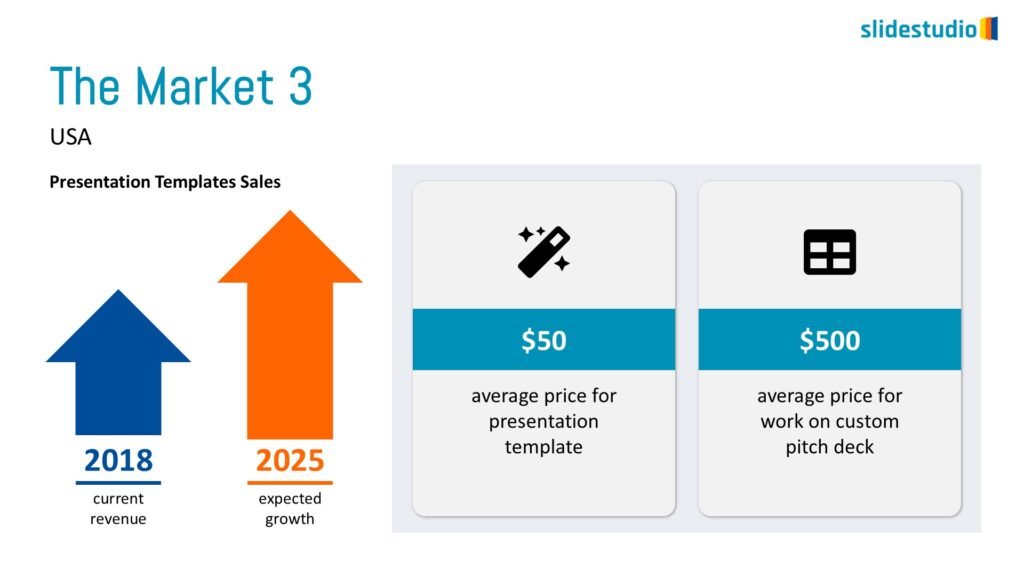
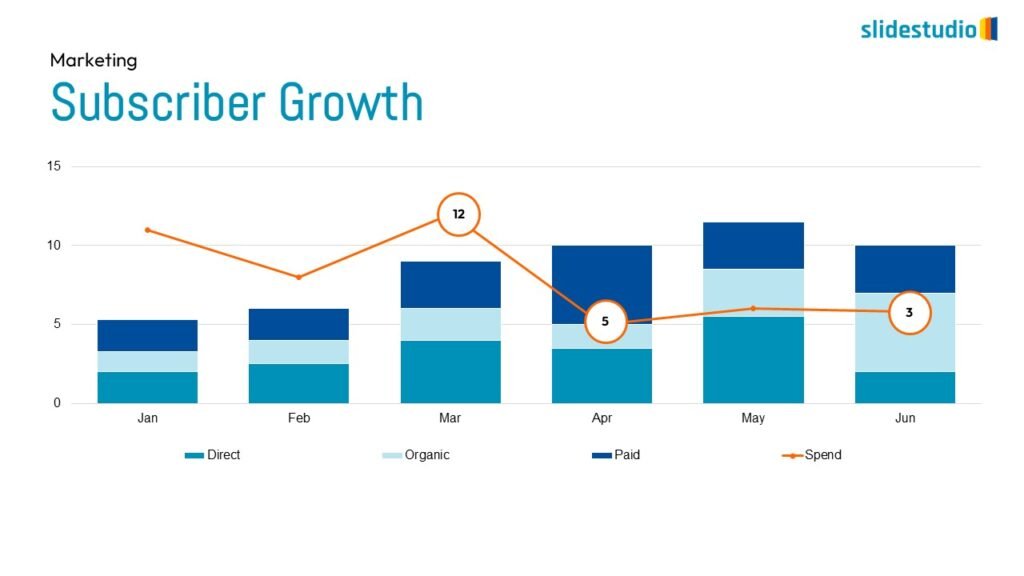
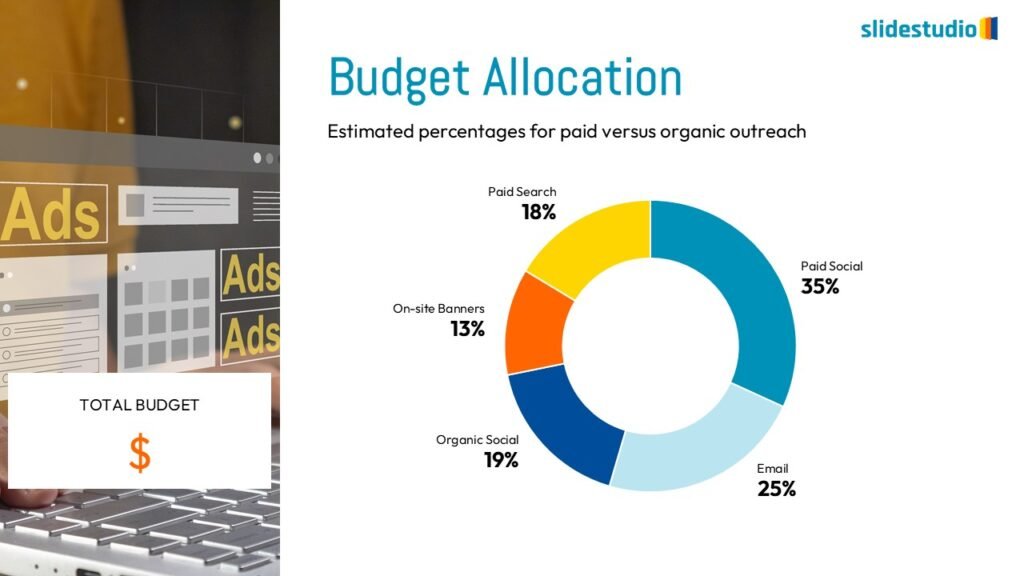
COMPARISON
Juxtaposes elements to highlight similarities and differences for easy comparison.
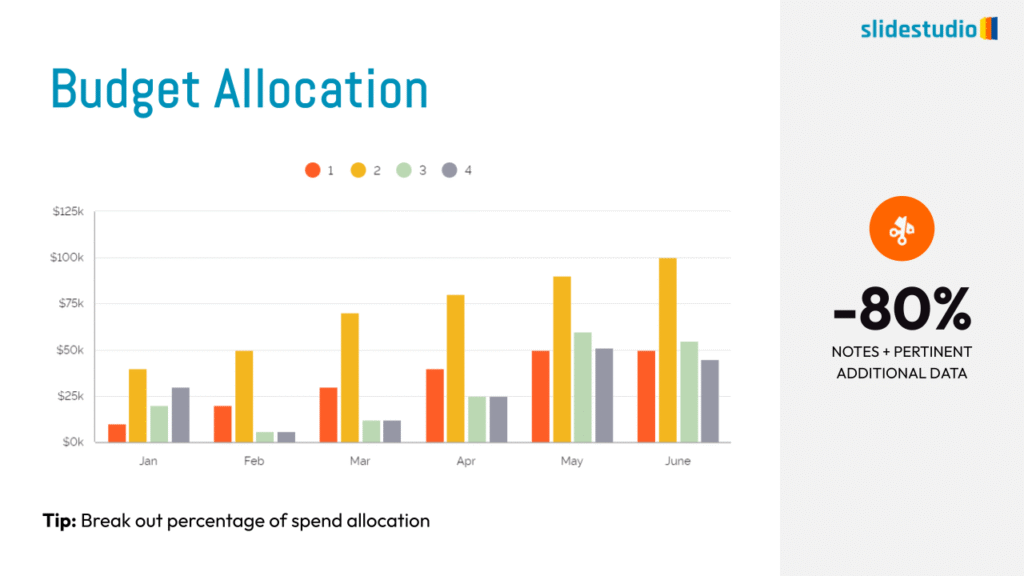
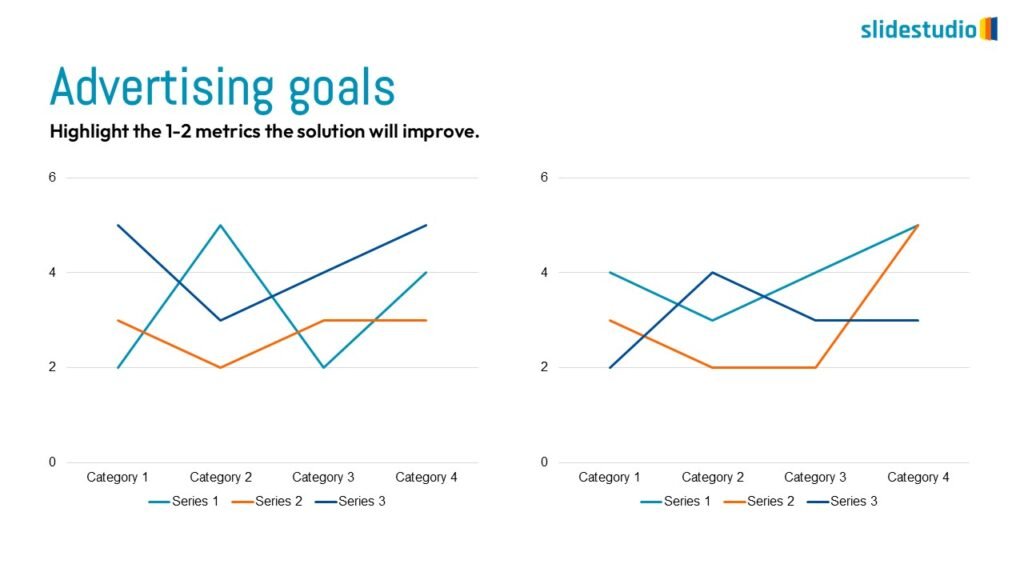
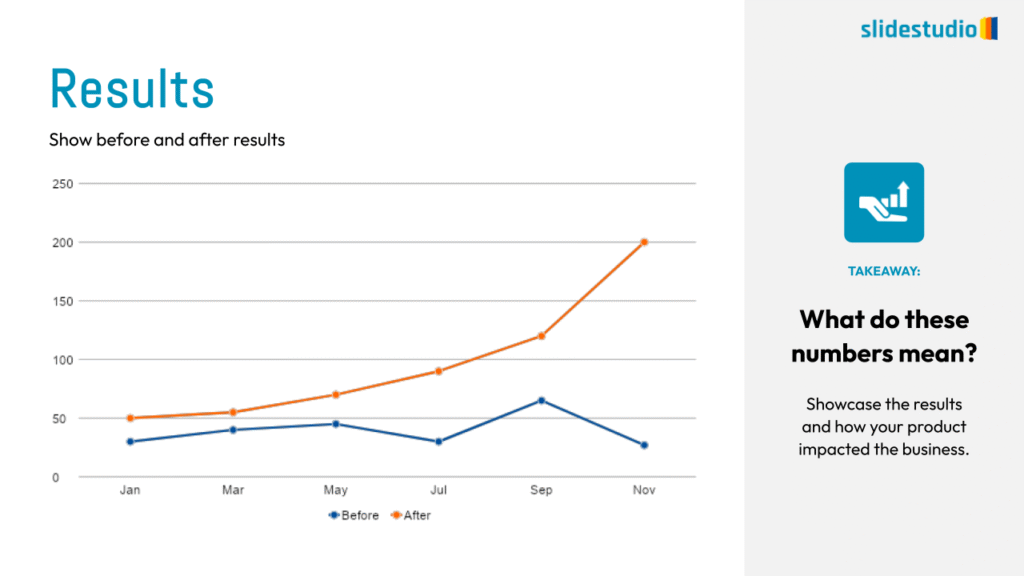
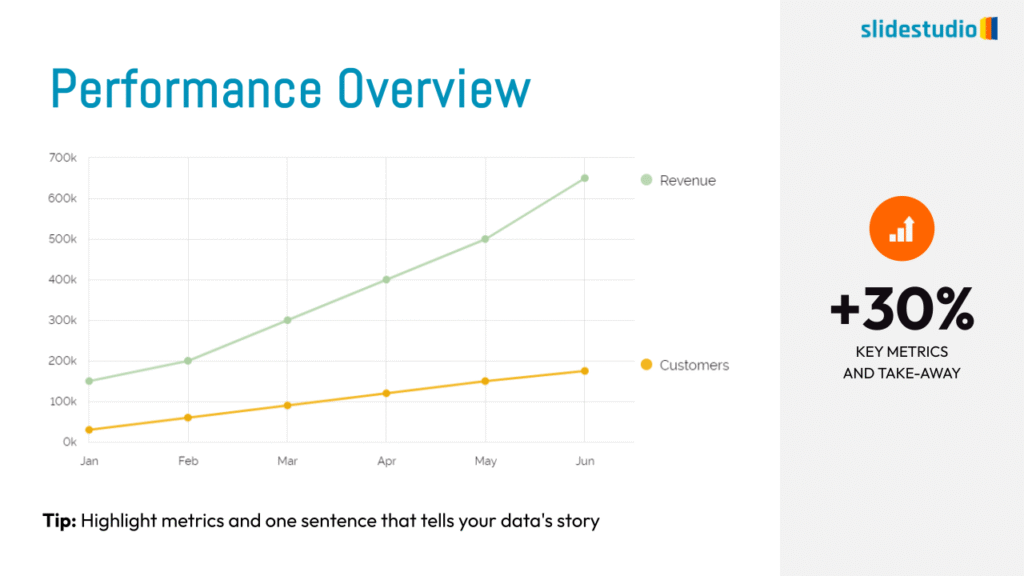
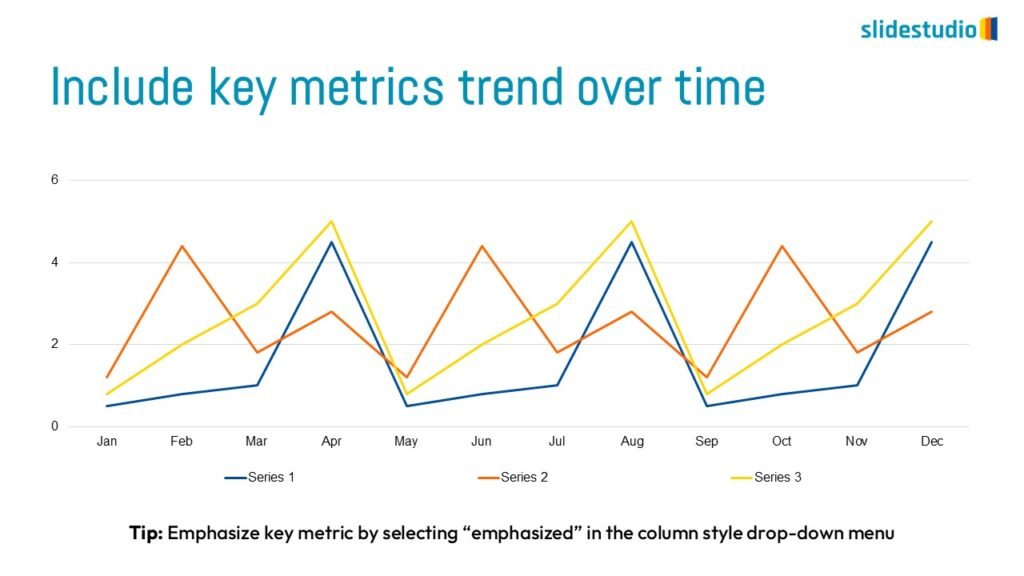
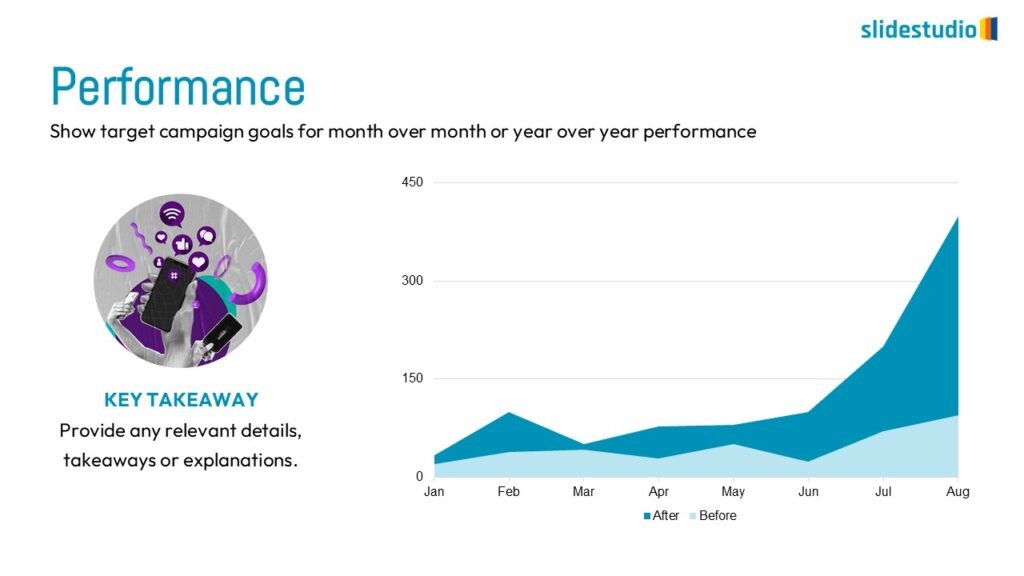
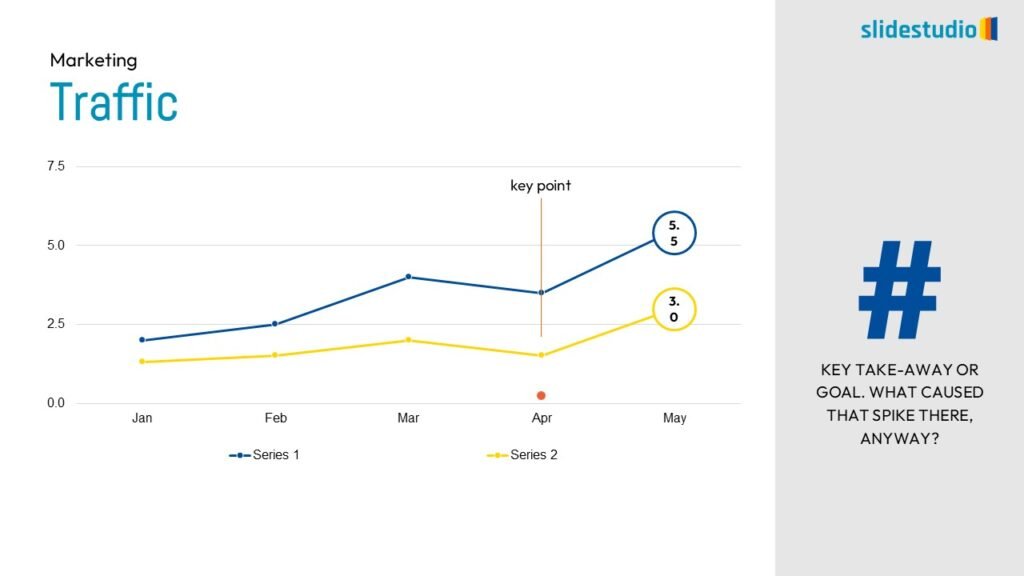
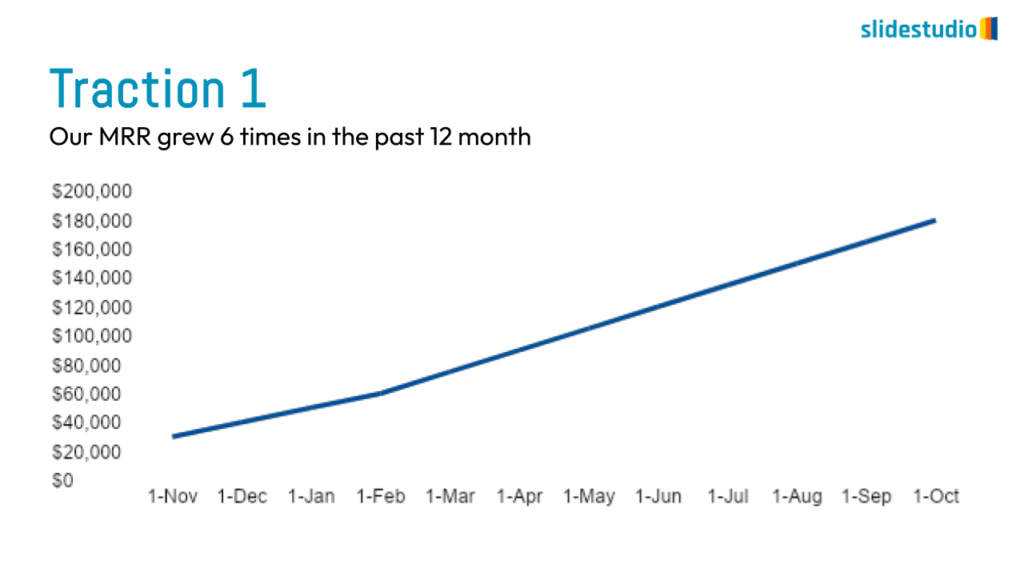
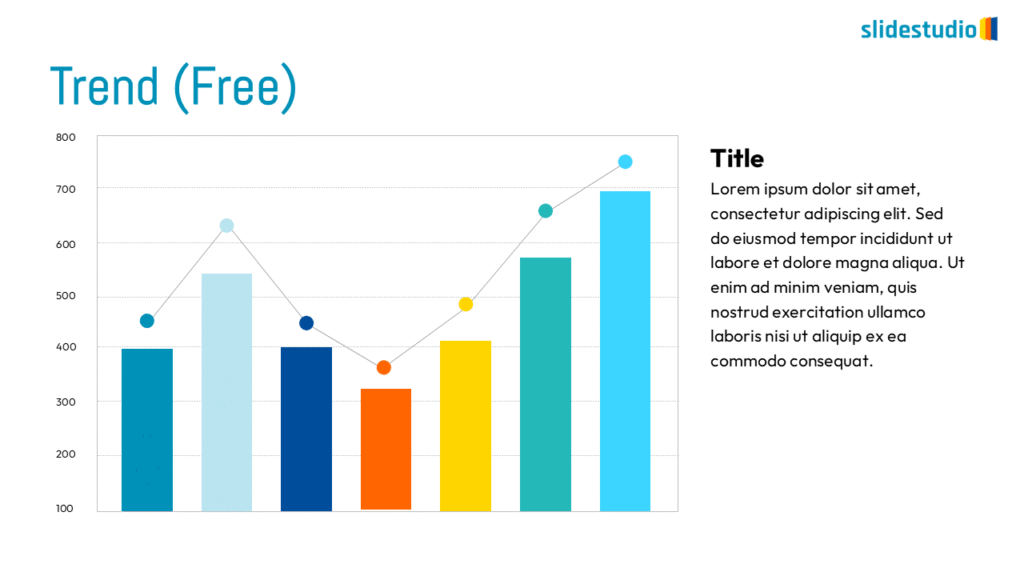
TREND
Juxtaposes elements to highlight similarities and differences for easy comparison.
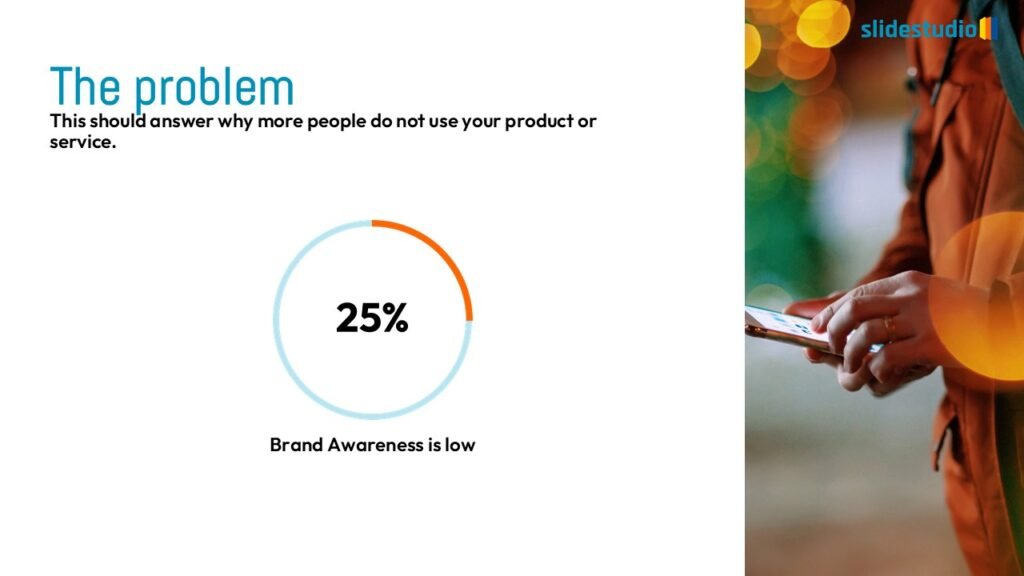
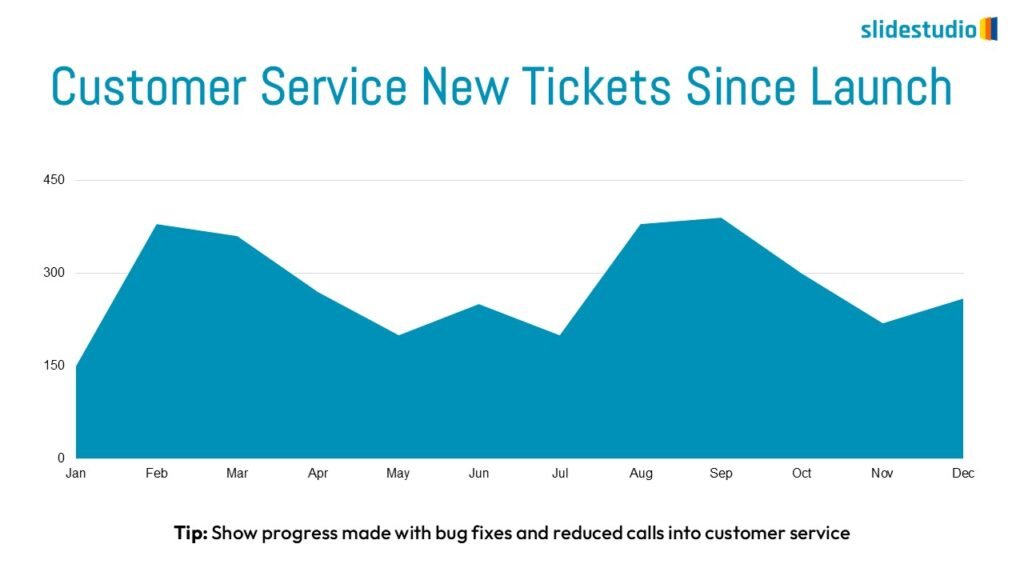
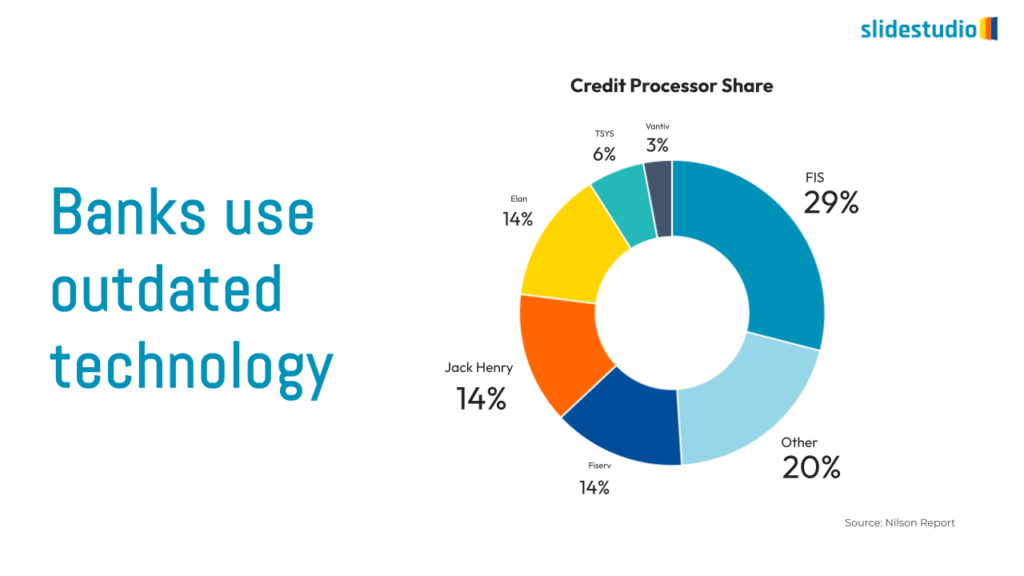
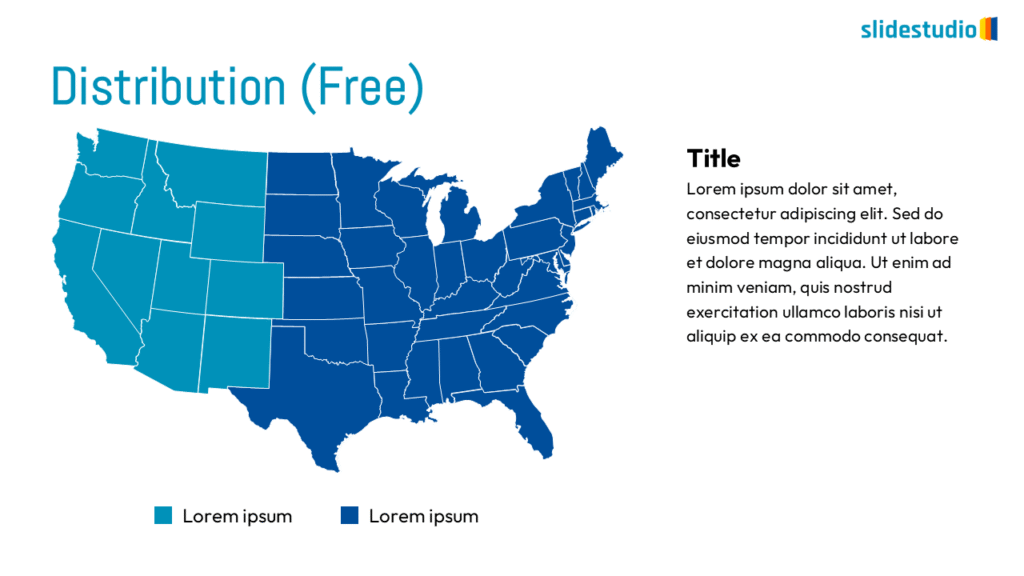
DISTRIBUTION
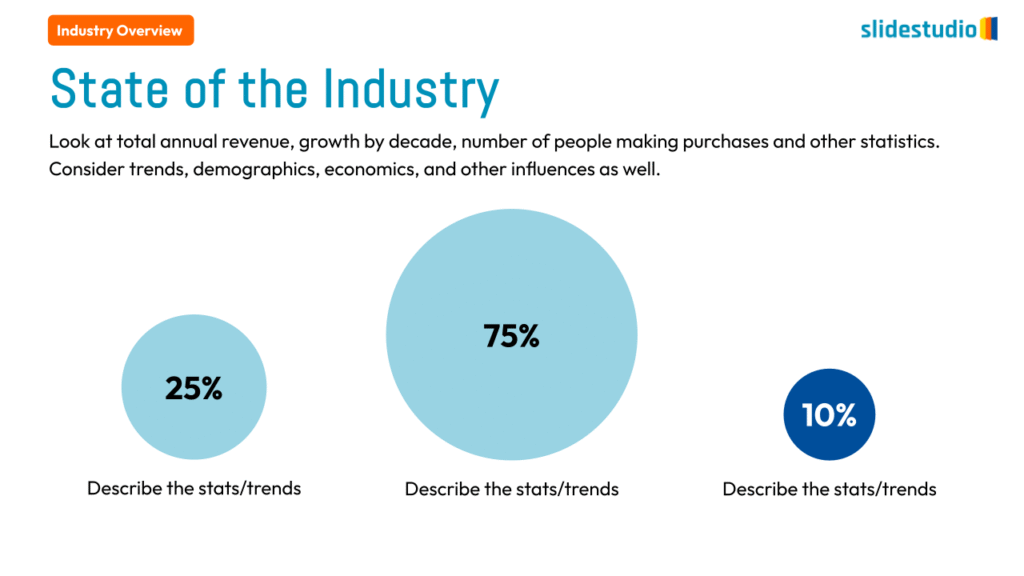
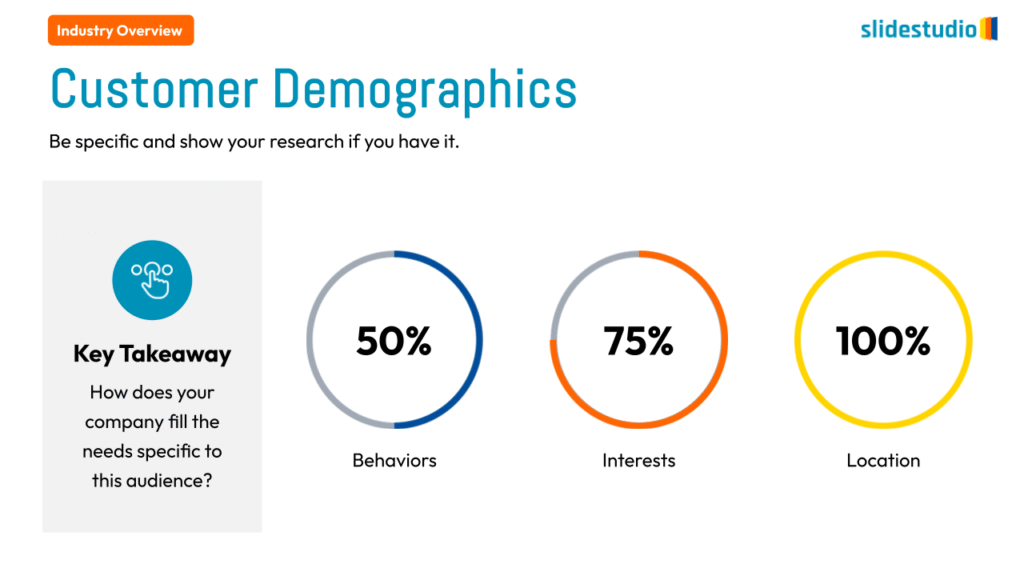
Visualizes the spread of data, useful for demographic breakdowns or statistical analysis.
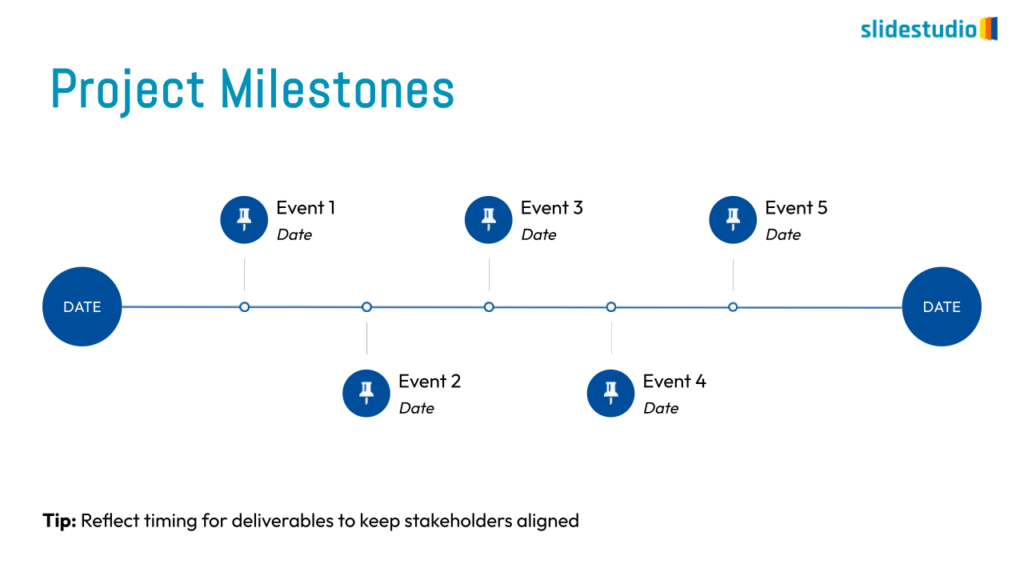
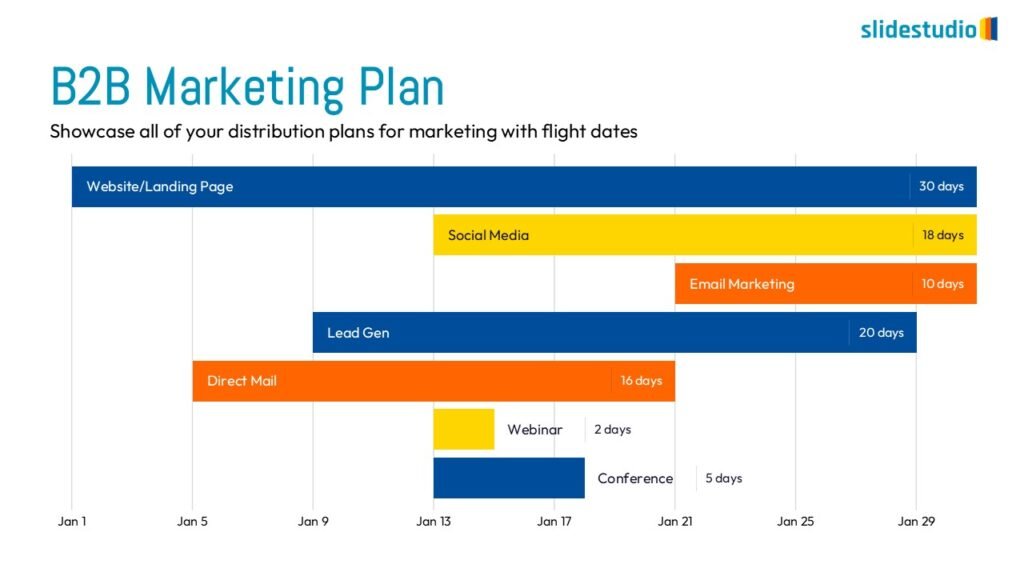
Flow
This concept focuses on illustrating the movement or progression of information. It can be represented in various forms, such as linear, circular, divergent/convergent, or multidirectional pathways, to convey how elements progress or connect in a sequence.
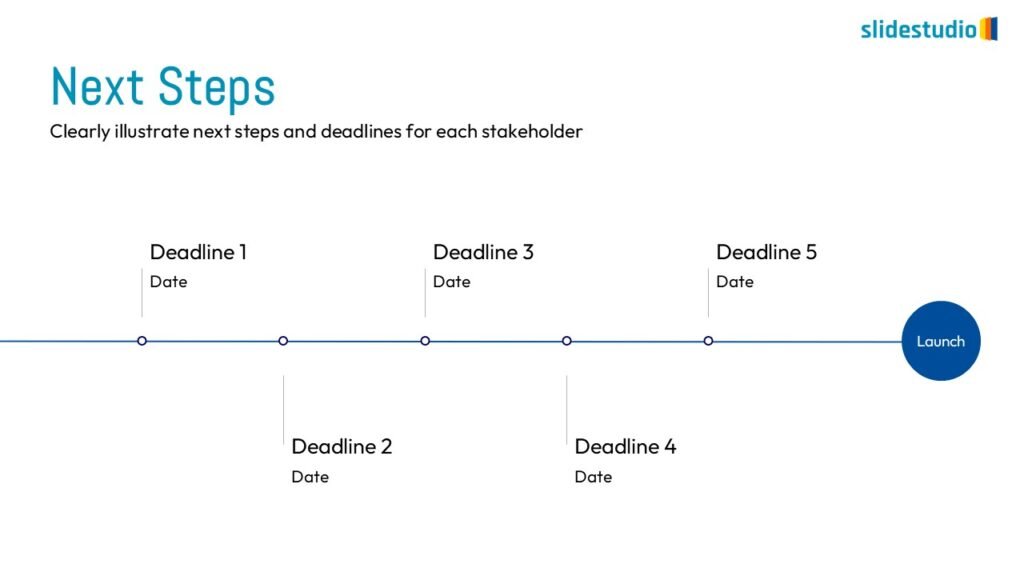
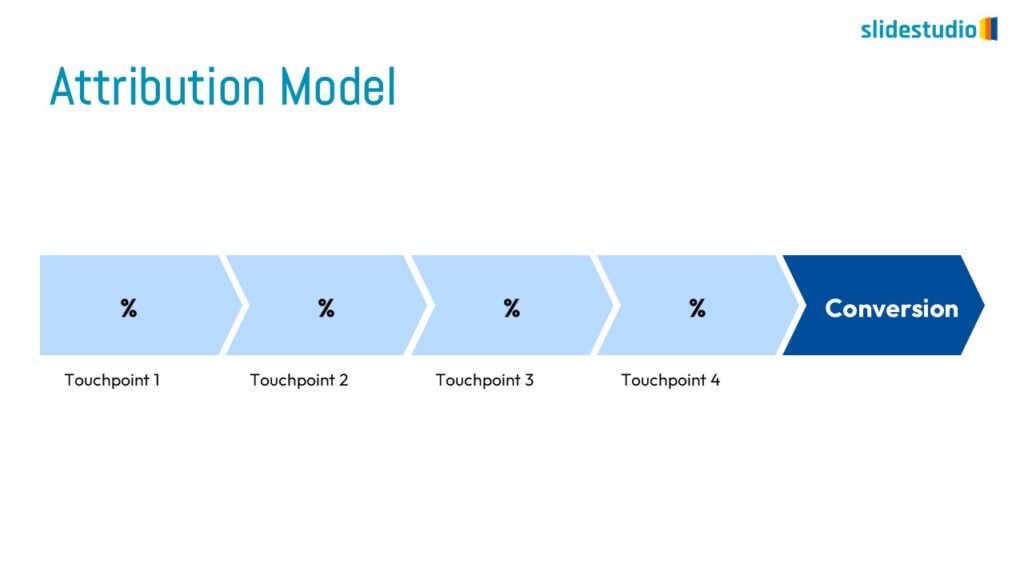
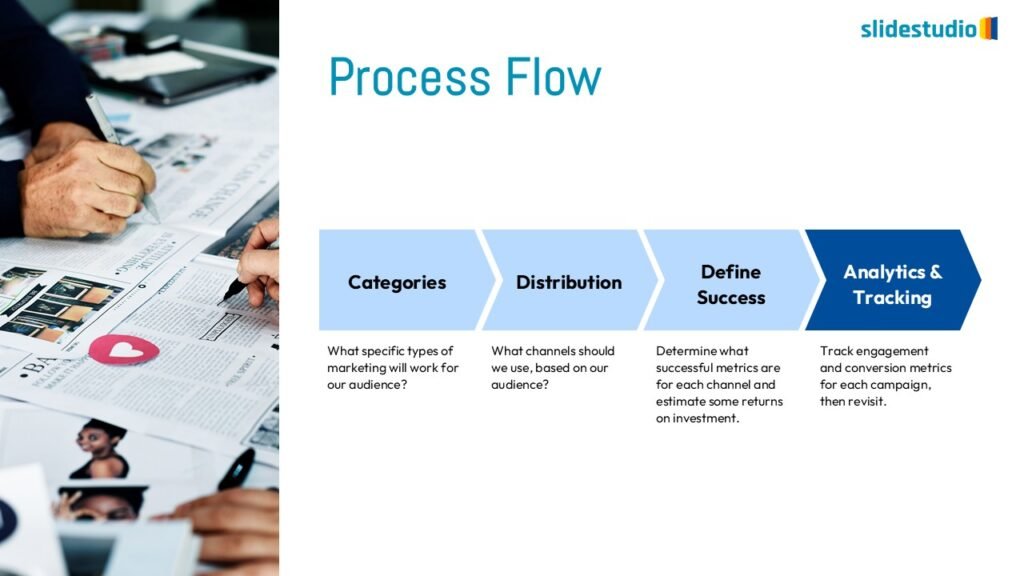
Linear
A step-by-step structure that illustrates a straightforward progression from start to finish.
circular
A repeating cycle that effectively conveys continuous processes or feedback loops.
DIVERGENT/CONVERGENT
A flow that branches out or converges, ideal for showing multiple pathways or merging ideas.
MULTIDIRECTIONAL
A complex structure that allows for movement in multiple directions, useful for networks and interconnected systems.
Structure
This concept organizes information hierarchically or categorically, often using matrices, trees, or layered arrangements. It helps to present the framework or arrangement of components within a system or process.
MATRICES
A grid format that compares information across categories or dimensions side-by-side.
TREES
A hierarchical layout that maps out connections, such as organizational charts or family trees.
LAYERS
A stacked structure that shows tiered information, with each layer building upon the previous one.
Cluster
This concept visually groups related items together, showing associations or overlaps. Cluster designs c to represent elements that belong together within a context or theme.
OVERLAPPING
Displays shared areas or intersections, useful for showing commonalities in Venn diagrams.
CLOSURE
Groups elements within a boundary to create unity and emphasize connection.
ENCLOSED
Organizes items within borders to highlight containment or separate categories.
LINKED
Connects elements with lines to illustrate relationships or associations.
Radiate
This concept shows elements extending outward from a central point, typically illustrating a spread or influence. It can be depicted with or without a core and represents a central idea that radiates outwards.
FROM POINT
Spreads outward from a central point, symbolizing expansion from a core idea.
WITH A CORE
Emphasizes a central hub that connects surrounding elements, ideal for mind maps.
WITHOUT A CORE
Illustrates diffusion or open-ended expansion without a specific focal point.
Pictorial
This concept uses images or icons to convey direction, location, reveal processes, or show influence. It provides a visual representation that is easy to understand and adds clarity to directional or procedural content.
DIRECTION
Uses arrows or paths to guide viewers through a specific route or sequence.
LOCATION
Pinpoints positions within a layout, helpful for mapping or highlighting key areas.
REVEAL
Gradually uncovers information step-by-step, ideal for phased presentations.
PROCESS
Shows stages within a workflow to visualize a continuous sequence of tasks.
INFLUENCE
Maps the impact of a central idea by showing its connections and reach.
Display Data
This concept focuses on presenting data in a visual format, such as comparisons, trends, or distributions. Common methods include charts, graphs, or other data visualization techniques to make information easier to interpret at a glance.
COMPARISON
Juxtaposes elements to highlight similarities and differences for easy comparison.
TREND
Juxtaposes elements to highlight similarities and differences for easy comparison.
DISTRIBUTION
Visualizes the spread of data, useful for demographic breakdowns or statistical analysis.
Flow
This concept focuses on illustrating the movement or progression of information. It can be represented in various forms, such as linear, circular, divergent/convergent, or multidirectional pathways, to convey how elements progress or connect in a sequence.
Linear
A step-by-step structure that illustrates a straightforward progression from start to finish.
circular
A repeating cycle that effectively conveys continuous processes or feedback loops.
DIVERGENT/CONVERGENT
A flow that branches out or converges, ideal for showing multiple pathways or merging ideas.
MULTIDIRECTIONAL
A complex structure that allows for movement in multiple directions, useful for networks and interconnected systems.
Structure
This concept organizes information hierarchically or categorically, often using matrices, trees, or layered arrangements. It helps to present the framework or arrangement of components within a system or process.
MATRICES
A grid format that compares information across categories or dimensions side-by-side.
TREES
A hierarchical layout that maps out connections, such as organizational charts or family trees.
LAYERS
A stacked structure that shows tiered information, with each layer building upon the previous one.
Cluster
This concept visually groups related items together, showing associations or overlaps. Cluster designs c to represent elements that belong together within a context or theme.
OVERLAPPING
Displays shared areas or intersections, useful for showing commonalities in Venn diagrams.
CLOSURE
Groups elements within a boundary to create unity and emphasize connection.
ENCLOSED
Organizes items within borders to highlight containment or separate categories.
LINKED
Connects elements with lines to illustrate relationships or associations.
Radiate
This concept shows elements extending outward from a central point, typically illustrating a spread or influence. It can be depicted with or without a core and represents a central idea that radiates outwards.
FROM POINT
Spreads outward from a central point, symbolizing expansion from a core idea.
WITH A CORE
Emphasizes a central hub that connects surrounding elements, ideal for mind maps.
WITHOUT A CORE
Illustrates diffusion or open-ended expansion without a specific focal point.
Pictorial
This concept uses images or icons to convey direction, location, reveal processes, or show influence. It provides a visual representation that is easy to understand and adds clarity to directional or procedural content.
DIRECTION
Uses arrows or paths to guide viewers through a specific route or sequence.
LOCATION
Pinpoints positions within a layout, helpful for mapping or highlighting key areas.
REVEAL
Gradually uncovers information step-by-step, ideal for phased presentations.
PROCESS
Shows stages within a workflow to visualize a continuous sequence of tasks.
INFLUENCE
Maps the impact of a central idea by showing its connections and reach.
Display Data
This concept focuses on presenting data in a visual format, such as comparisons, trends, or distributions. Common methods include charts, graphs, or other data visualization techniques to make information easier to interpret at a glance.
COMPARISON
Juxtaposes elements to highlight similarities and differences for easy comparison.
TREND
Juxtaposes elements to highlight similarities and differences for easy comparison.
DISTRIBUTION
Visualizes the spread of data, useful for demographic breakdowns or statistical analysis.