“Comparison Infographics 5” has been added to your cart. View cart
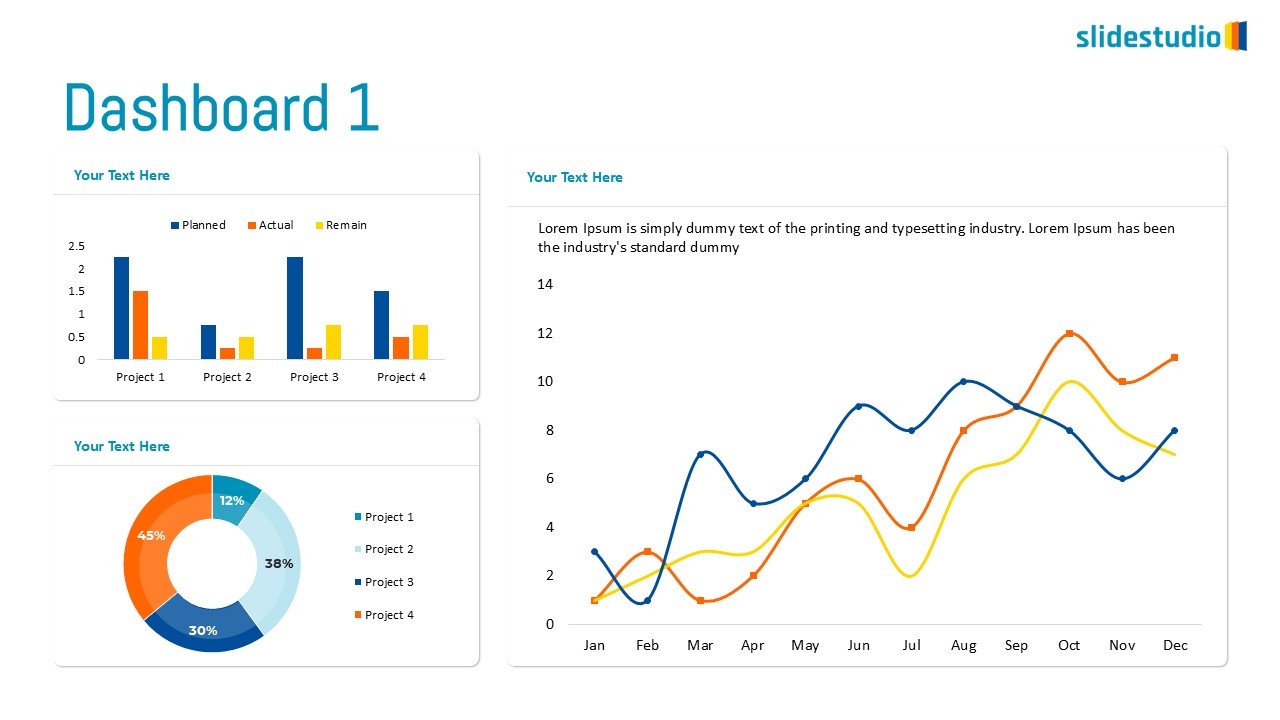
Dashboard 1
This comprehensive dashboard slide provides a multi-faceted view of data through three distinct chart types, neatly organized within a clean white layout. The upper-left quadrant features a stacked bar chart, comparing “Planned,” “Actual,” and “Remain” metrics across four projects, offering insights into project performance. Below it, a donut chart breaks down project contributions by percentage (45% orange, 30% dark blue, 12% light blue, 38% teal). The right side of the slide is dominated by a line graph, illustrating trends over a 12-month period (January to December) across three data series. Each chart area includes a “Your Text Here” placeholder, allowing for customization and specific data context. This slide is ideal for presenting project dashboards, financial summaries, or general business performance reports, enabling a quick and comprehensive overview of key metrics and trends.
A detailed answer to provide information about your business, build trust with potential customers, or help the visitor with a problem they may be encountering
A detailed answer to provide information about your business, build trust with potential customers, or help the visitor with a problem they may be encountering
A detailed answer to provide information about your business, build trust with potential customers, or help the visitor with a problem they may be encountering
A detailed answer to provide information about your business, build trust with potential customers, or help the visitor with a problem they may be encountering
A detailed answer to provide information about your business, build trust with potential customers, or help the visitor with a problem they may be encountering
A detailed answer to provide information about your business, build trust with potential customers, or help the visitor with a problem they may be encountering
A detailed answer to provide information about your business, build trust with potential customers, or help the visitor with a problem they may be encountering
A detailed answer to provide information about your business, build trust with potential customers, or help the visitor with a problem they may be encountering
Customer Reviews
“A review from a customer who benefited from your product. Reviews can be a highly effective way of establishing credibility and increasing your company's reputation.”
Customer Name
“A review from a customer who benefited from your product. Reviews can be a highly effective way of establishing credibility and increasing your company's reputation.”
Customer Name
“A review from a customer who benefited from your product. Reviews can be a highly effective way of establishing credibility and increasing your company's reputation.”