“Business Plan Infographics 3” has been added to your cart. View cart
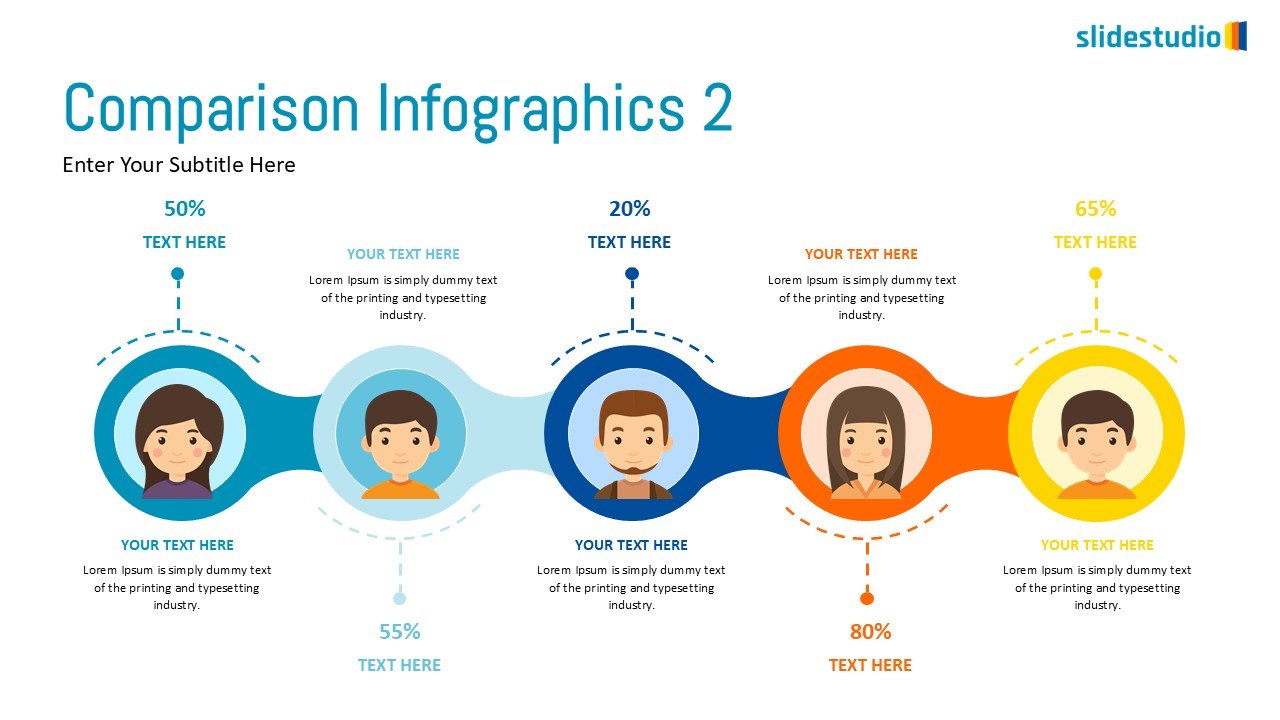
Comparison Infographics 2
This engaging slide features a horizontal comparison infographic designed as a connected chain of six circular elements, each showcasing an avatar of a person. The circles alternate between blue and orange hues, creating a visually appealing flow. Four prominent data points (50%, 55%, 20%, 80%, 65%) are highlighted with dashed lines extending from specific avatars, providing key metrics for comparison. Each avatar is accompanied by multiple text boxes, offering extensive space for detailed descriptions, characteristics, or comparative analysis. This slide is ideal for comparing different user segments, demographics, survey results, or team members, presenting complex comparisons in an accessible and visually rich format.
A detailed answer to provide information about your business, build trust with potential customers, or help the visitor with a problem they may be encountering
A detailed answer to provide information about your business, build trust with potential customers, or help the visitor with a problem they may be encountering
A detailed answer to provide information about your business, build trust with potential customers, or help the visitor with a problem they may be encountering
A detailed answer to provide information about your business, build trust with potential customers, or help the visitor with a problem they may be encountering
A detailed answer to provide information about your business, build trust with potential customers, or help the visitor with a problem they may be encountering
A detailed answer to provide information about your business, build trust with potential customers, or help the visitor with a problem they may be encountering
A detailed answer to provide information about your business, build trust with potential customers, or help the visitor with a problem they may be encountering
A detailed answer to provide information about your business, build trust with potential customers, or help the visitor with a problem they may be encountering
Customer Reviews
“A review from a customer who benefited from your product. Reviews can be a highly effective way of establishing credibility and increasing your company's reputation.”
Customer Name
“A review from a customer who benefited from your product. Reviews can be a highly effective way of establishing credibility and increasing your company's reputation.”
Customer Name
“A review from a customer who benefited from your product. Reviews can be a highly effective way of establishing credibility and increasing your company's reputation.”