“Charts & Graphs 1” has been added to your cart. View cart
All Hands Meeting Template 4
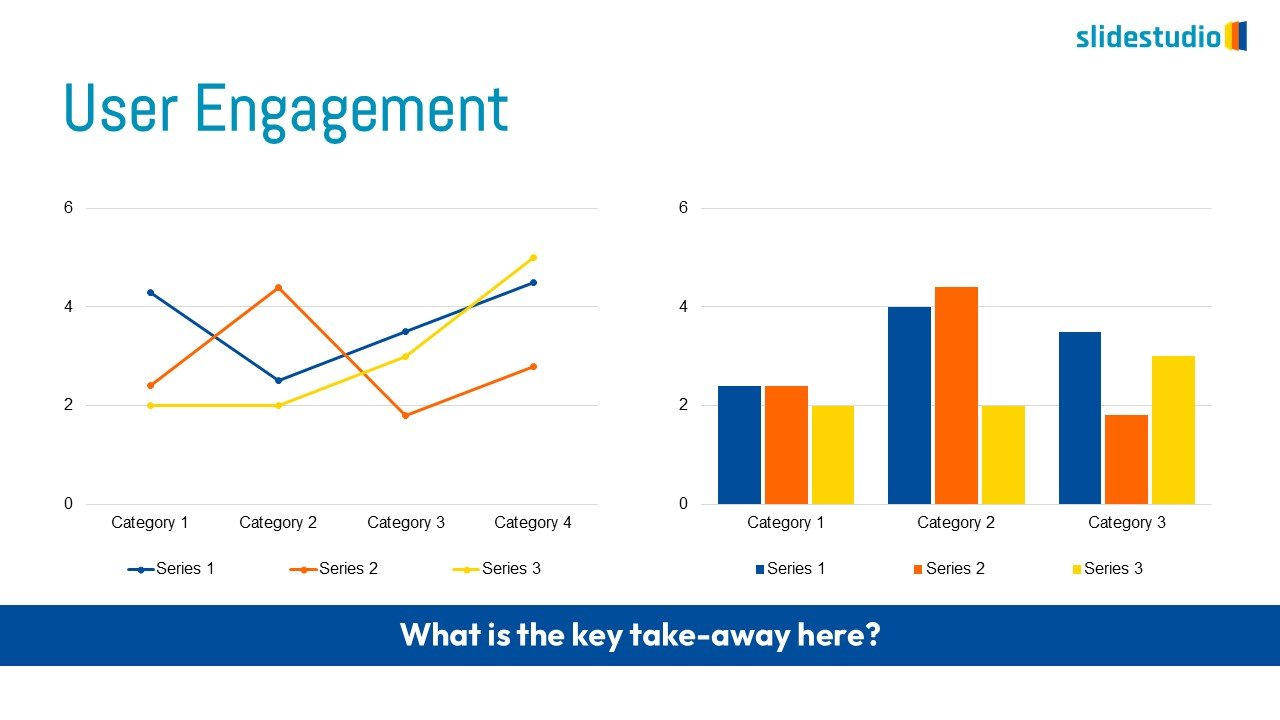
The slide features a prominent “User Engagement” title and displays two distinct data visualizations side-by-side: a line graph on the left and a bar chart on the right, both illustrating trends or comparisons across categories with multiple data series. A bold blue footer asks, “What is the key take-away here?”, prompting audience engagement. This data-heavy, analytical format is highly effective for presenting performance metrics, trends, and comparisons in a visually digestible way, making it ideal for business reviews, quarterly reports, or strategy meetings where marketing teams, product managers, or analysts need to convey insights and drive discussion on user behavior or campaign performance to executives, stakeholders, or team members.
A detailed answer to provide information about your business, build trust with potential customers, or help the visitor with a problem they may be encountering
A detailed answer to provide information about your business, build trust with potential customers, or help the visitor with a problem they may be encountering
A detailed answer to provide information about your business, build trust with potential customers, or help the visitor with a problem they may be encountering
A detailed answer to provide information about your business, build trust with potential customers, or help the visitor with a problem they may be encountering
A detailed answer to provide information about your business, build trust with potential customers, or help the visitor with a problem they may be encountering
A detailed answer to provide information about your business, build trust with potential customers, or help the visitor with a problem they may be encountering
A detailed answer to provide information about your business, build trust with potential customers, or help the visitor with a problem they may be encountering
A detailed answer to provide information about your business, build trust with potential customers, or help the visitor with a problem they may be encountering
Customer Reviews
“A review from a customer who benefited from your product. Reviews can be a highly effective way of establishing credibility and increasing your company's reputation.”
Customer Name
“A review from a customer who benefited from your product. Reviews can be a highly effective way of establishing credibility and increasing your company's reputation.”
Customer Name
“A review from a customer who benefited from your product. Reviews can be a highly effective way of establishing credibility and increasing your company's reputation.”