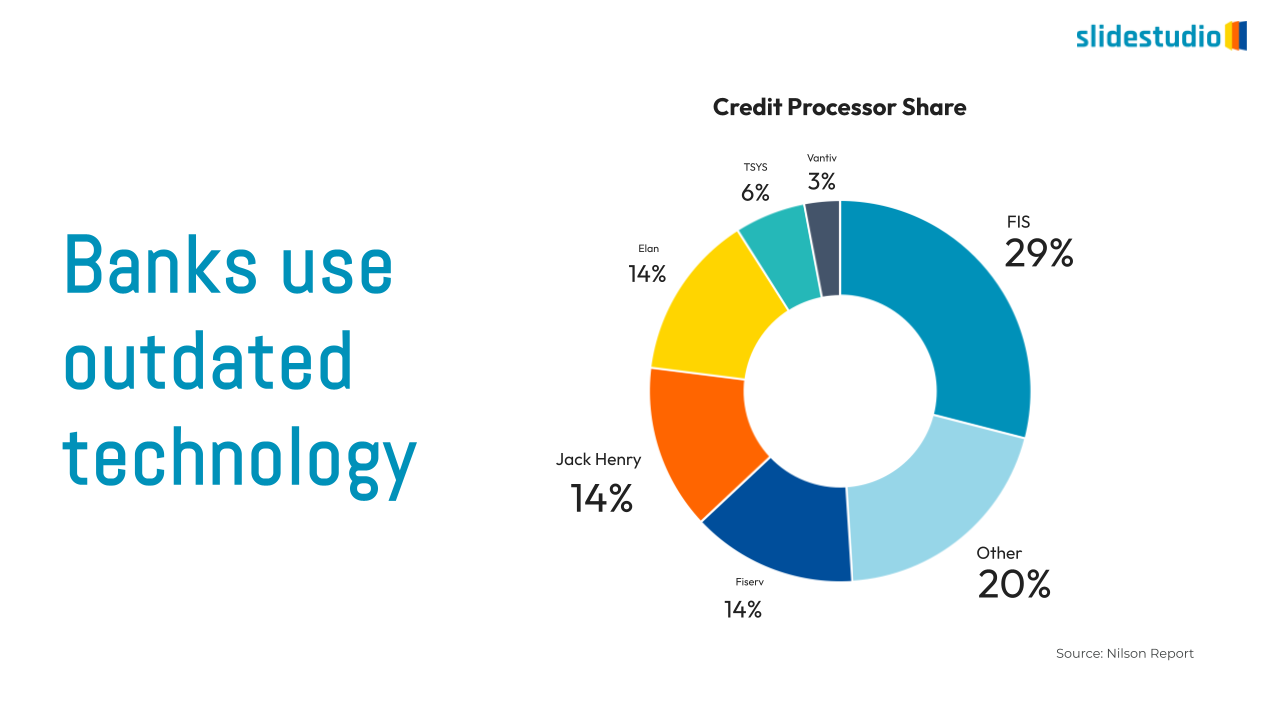
The presentation offers a dynamic donut chart visualization, specifically designed to display market share or proportional data in a clear and engaging way. Its color-coded segments with bold percentage labels allow for quick interpretation of data, making it ideal for market share analysis, investment portfolio breakdowns, survey results, or demographic distributions. This template is highly beneficial for data analysts, marketing professionals, business strategists, and financial planners who need to visually represent parts of a whole with high impact.
A detailed answer to provide information about your business, build trust with potential customers, or help the visitor with a problem they may be encountering
A detailed answer to provide information about your business, build trust with potential customers, or help the visitor with a problem they may be encountering
A detailed answer to provide information about your business, build trust with potential customers, or help the visitor with a problem they may be encountering
A detailed answer to provide information about your business, build trust with potential customers, or help the visitor with a problem they may be encountering
A detailed answer to provide information about your business, build trust with potential customers, or help the visitor with a problem they may be encountering
A detailed answer to provide information about your business, build trust with potential customers, or help the visitor with a problem they may be encountering
A detailed answer to provide information about your business, build trust with potential customers, or help the visitor with a problem they may be encountering
A detailed answer to provide information about your business, build trust with potential customers, or help the visitor with a problem they may be encountering
Customer Reviews
“A review from a customer who benefited from your product. Reviews can be a highly effective way of establishing credibility and increasing your company's reputation.”
Customer Name
“A review from a customer who benefited from your product. Reviews can be a highly effective way of establishing credibility and increasing your company's reputation.”
Customer Name
“A review from a customer who benefited from your product. Reviews can be a highly effective way of establishing credibility and increasing your company's reputation.”