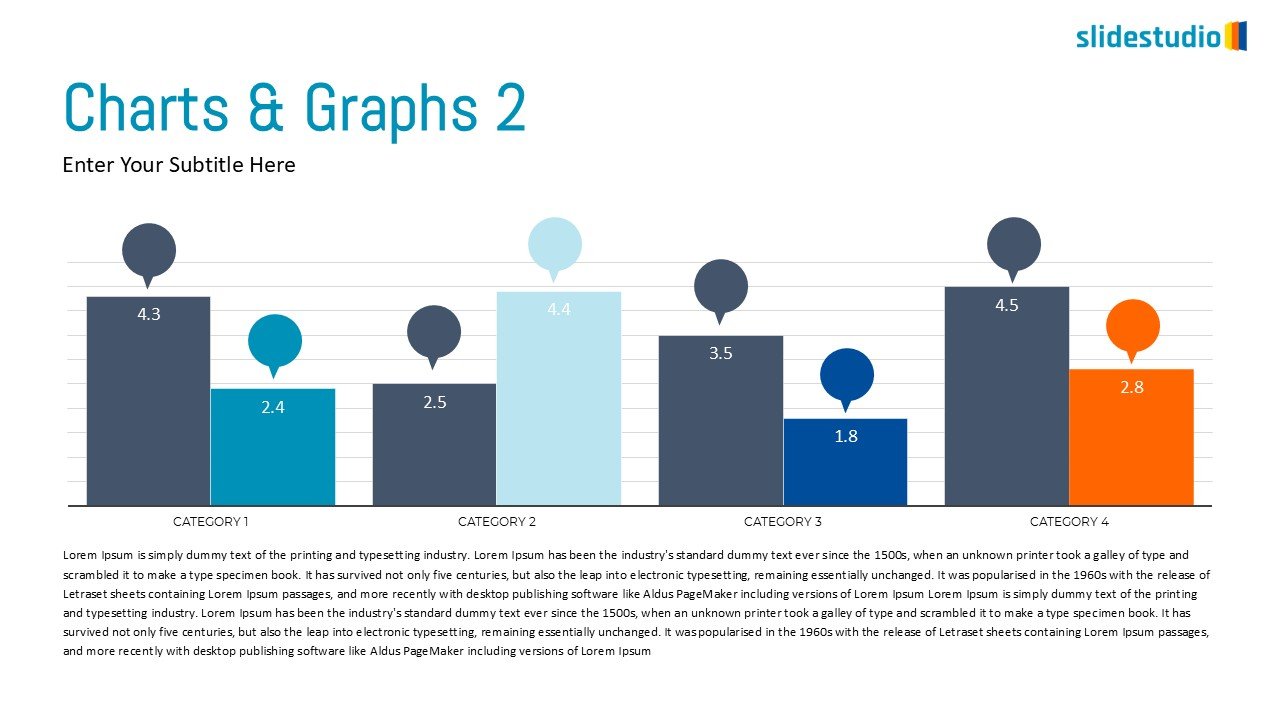
This informative slide presents a sophisticated bar chart featuring four distinct categories, each with two associated data bars for comparative analysis. The bars utilize a palette of dark grey, blue, and orange, clearly displaying numerical values at their peaks. Each data series is further enhanced with a circular indicator. A horizontal gridline background aids in easy data interpretation. Below the chart, a substantial text block provides ample space for detailed analysis, conclusions, or supporting information related to the presented data. This slide is ideal for in-depth data visualization, comparing different metrics within categories, and supporting statistical presentations.
A detailed answer to provide information about your business, build trust with potential customers, or help the visitor with a problem they may be encountering
A detailed answer to provide information about your business, build trust with potential customers, or help the visitor with a problem they may be encountering
A detailed answer to provide information about your business, build trust with potential customers, or help the visitor with a problem they may be encountering
A detailed answer to provide information about your business, build trust with potential customers, or help the visitor with a problem they may be encountering
A detailed answer to provide information about your business, build trust with potential customers, or help the visitor with a problem they may be encountering
A detailed answer to provide information about your business, build trust with potential customers, or help the visitor with a problem they may be encountering
A detailed answer to provide information about your business, build trust with potential customers, or help the visitor with a problem they may be encountering
A detailed answer to provide information about your business, build trust with potential customers, or help the visitor with a problem they may be encountering
Customer Reviews
“A review from a customer who benefited from your product. Reviews can be a highly effective way of establishing credibility and increasing your company's reputation.”
Customer Name
“A review from a customer who benefited from your product. Reviews can be a highly effective way of establishing credibility and increasing your company's reputation.”
Customer Name
“A review from a customer who benefited from your product. Reviews can be a highly effective way of establishing credibility and increasing your company's reputation.”